2023 Laboratory Division Annual Report
Table of Contents
- Mission
- Laboratory Leadership
- Laboratory Organization
- Introduction
- Forensic Science Laboratories Service Overview
- Criminalistics
- Drug ID
- Fire Debris
- Firearms
- Biology/DNA
- Toxicology
Mission
The Forensic Science Center strives to provide the highest quality medicolegal and advanced forensic laboratory services to Sedgwick County. Death Investigation and Forensic Autopsy services are conducted in a compassionate and objective manner to achieve accurate certification of cause and manner of death. The Forensic Laboratory services provide unbiased and accurate analytical testing to support the resolution of criminal cases. As an independent agency operating under the Division of Public Safety, the Forensic Science Center collaborates with public health and criminal justice stakeholders to reduce crime and prevent deaths.
Laboratory Leadership
Director
Shelly Steadman, Ph.D.
Quality Assurance and Compliance Manager, LIMS Administrator
Robert C. Hansen II, M.S.F.S
Toxicology Laboratory Manager
Kimberly Youso, M.S., D-ABFT-FT
Criminalistics Laboratory Manager
Lana Goodson
Forensic Biology / DNA Laboratory Manager
Sarah Geering, M.S.
Laboratory Organization
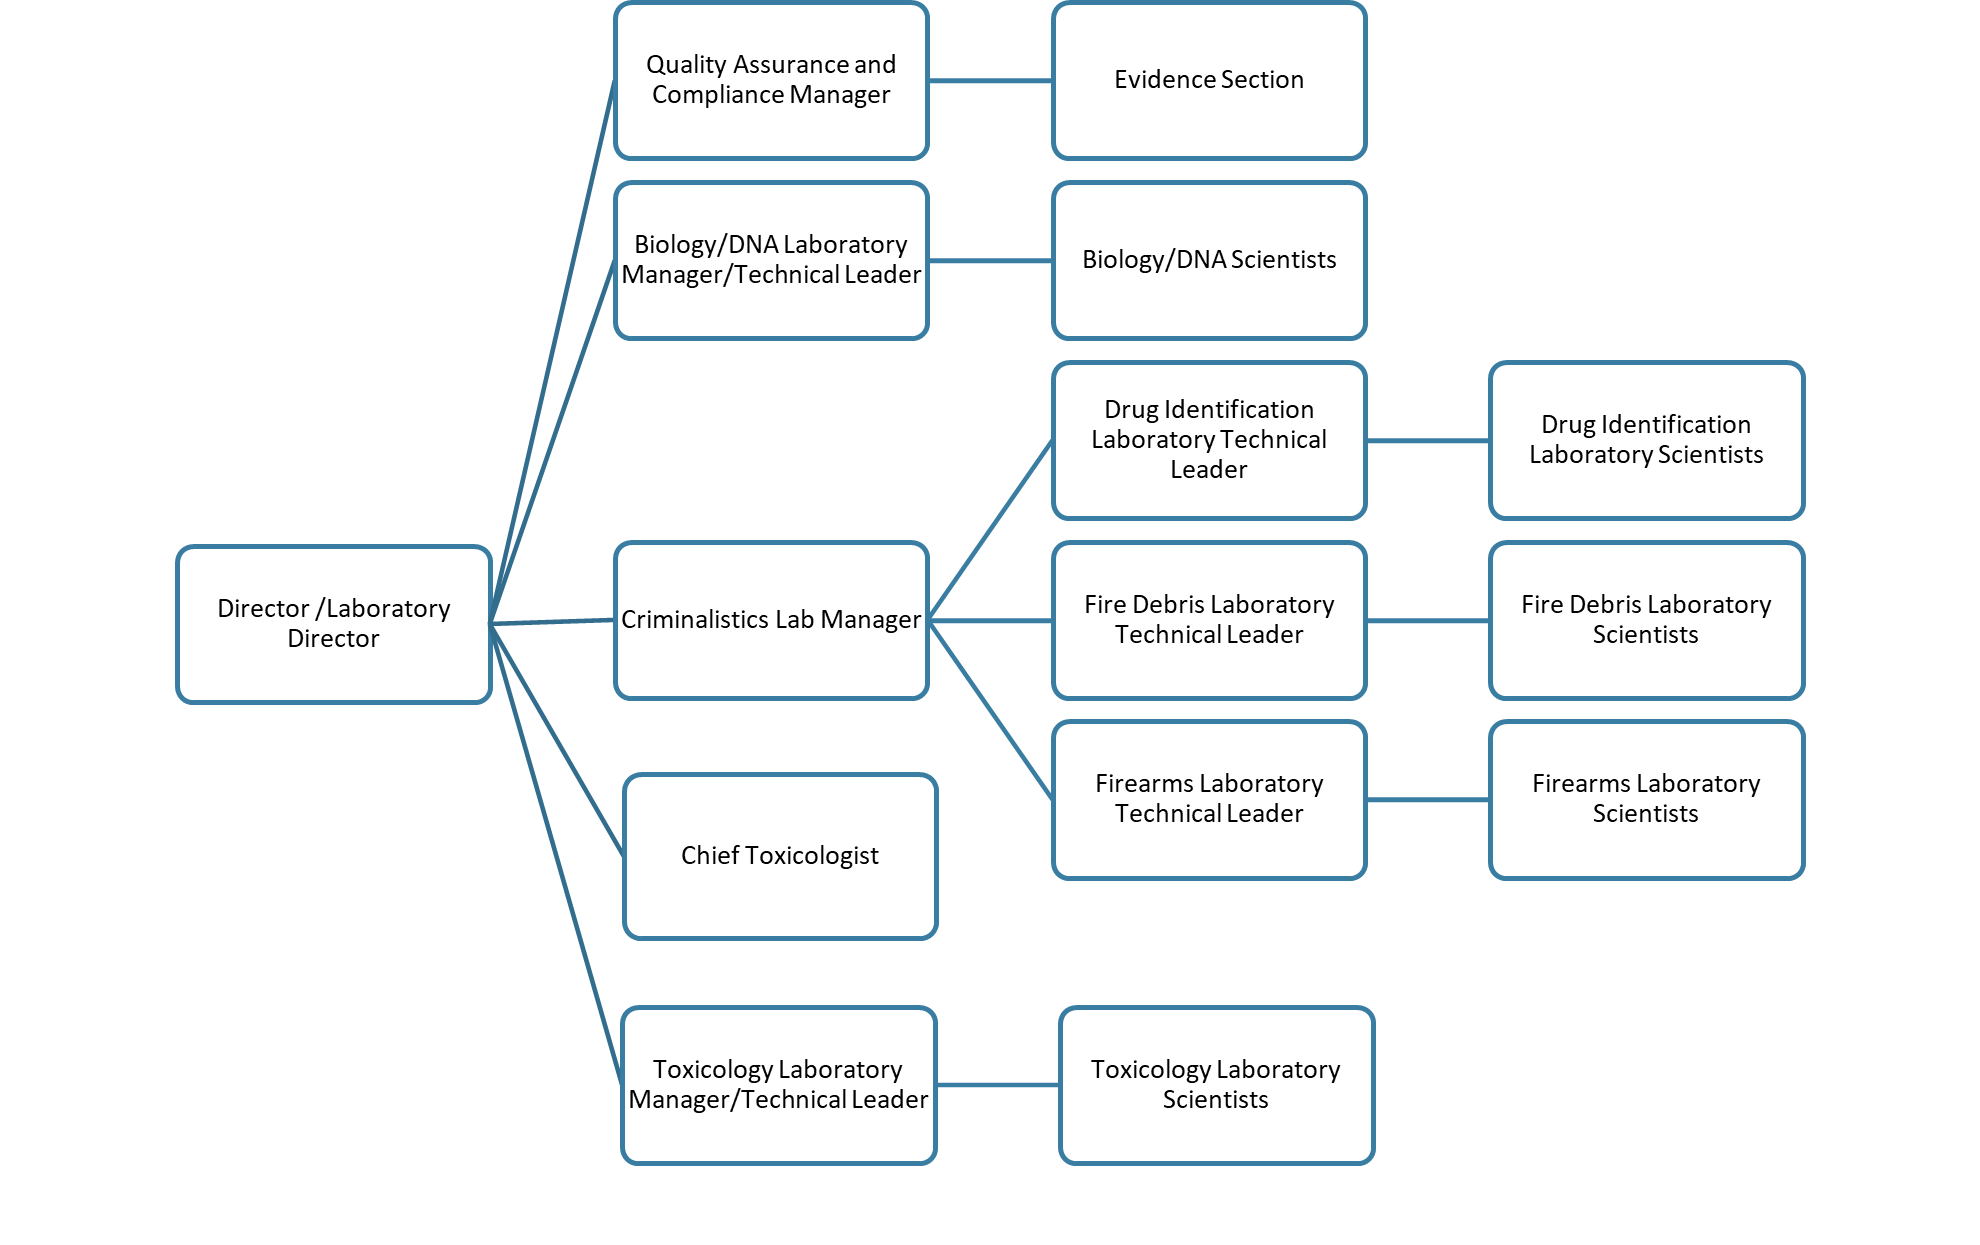
Introduction
The Regional Forensic Science Center (RFSC) officially opened on December 21st, 1995. The Center houses the Office of the District Coroner and the Forensic Science Laboratories. The Forensic Science Laboratories are comprised of three major sections: Criminalistics (Drug Identification, Firearms, and Fire Debris), Biology/DNA, and Toxicology (Antemortem and Postmortem).
The Forensic Science Laboratory is staffed with highly trained and experienced forensic scientists, many of whom have advanced scientific degrees (MS, MSFS, PhD). For 2023, the laboratory staff consisted of 22 scientists and 2 support personnel.
In April of 1996, the Forensic Science Laboratory began accepting cases for firearms examinations. Three months later, the Biology Laboratory provided forensic examinations for the identification of biological fluids. The Toxicology Laboratory began producing comprehensive examinations in postmortem toxicology in support of the Sedgwick County District Coroner (District Coroner) in September of 1996. This was followed by the Forensic Science Laboratories providing forensic drug identification for local and regional law enforcement agencies. In November of 1996, fire debris analysis was added to the Criminalistics Section. In January of 1997, the Biology/DNA Laboratory became the first short tandem repeat-deoxynucleic acid (STR-DNA) testing laboratory in the State of Kansas.
In 2003, the Forensic Science Laboratory first became accredited by the American Society of Crime Laboratory Directors/Laboratory Accreditation Board (ASCLD/LAB) under the ASCLD/LAB-Legacy program.
In February 2014, the Forensic Laboratory was granted ASCLD/LAB-International accreditation for Forensic Testing Laboratories in the categories of Controlled Substances, Quantitative Analysis, Antemortem Toxicology, Postmortem Toxicology, DNA-Nuclear, Body Fluid Identification, Fire Debris, Firearms, and Serial Number Restoration. The ASCLD/LAB-International accreditation program evaluates the laboratory’s management system, and technical procedures and practices against criteria set forth in ISO/IEC 17025:2005, and the testing laboratory requirements of the ASCLD/LAB-International Supplemental Requirements.
In 2018, the Forensic Science Laboratory completed an ANAB ISO/IEC 17025:2017, AR3125 full assessment. The laboratory was the first in the state and among the first in the nation to undergo assessment for these new international accreditation standards. This enhanced accreditation program is based upon the latest set of requirements against which a forensic testing laboratory can be evaluated.
Striving for and meeting these accreditation requirements demonstrates the Forensic Laboratory’s commitment to excellence in the services we provide to submitting agencies.
Forensic Science Laboratories Service Overview
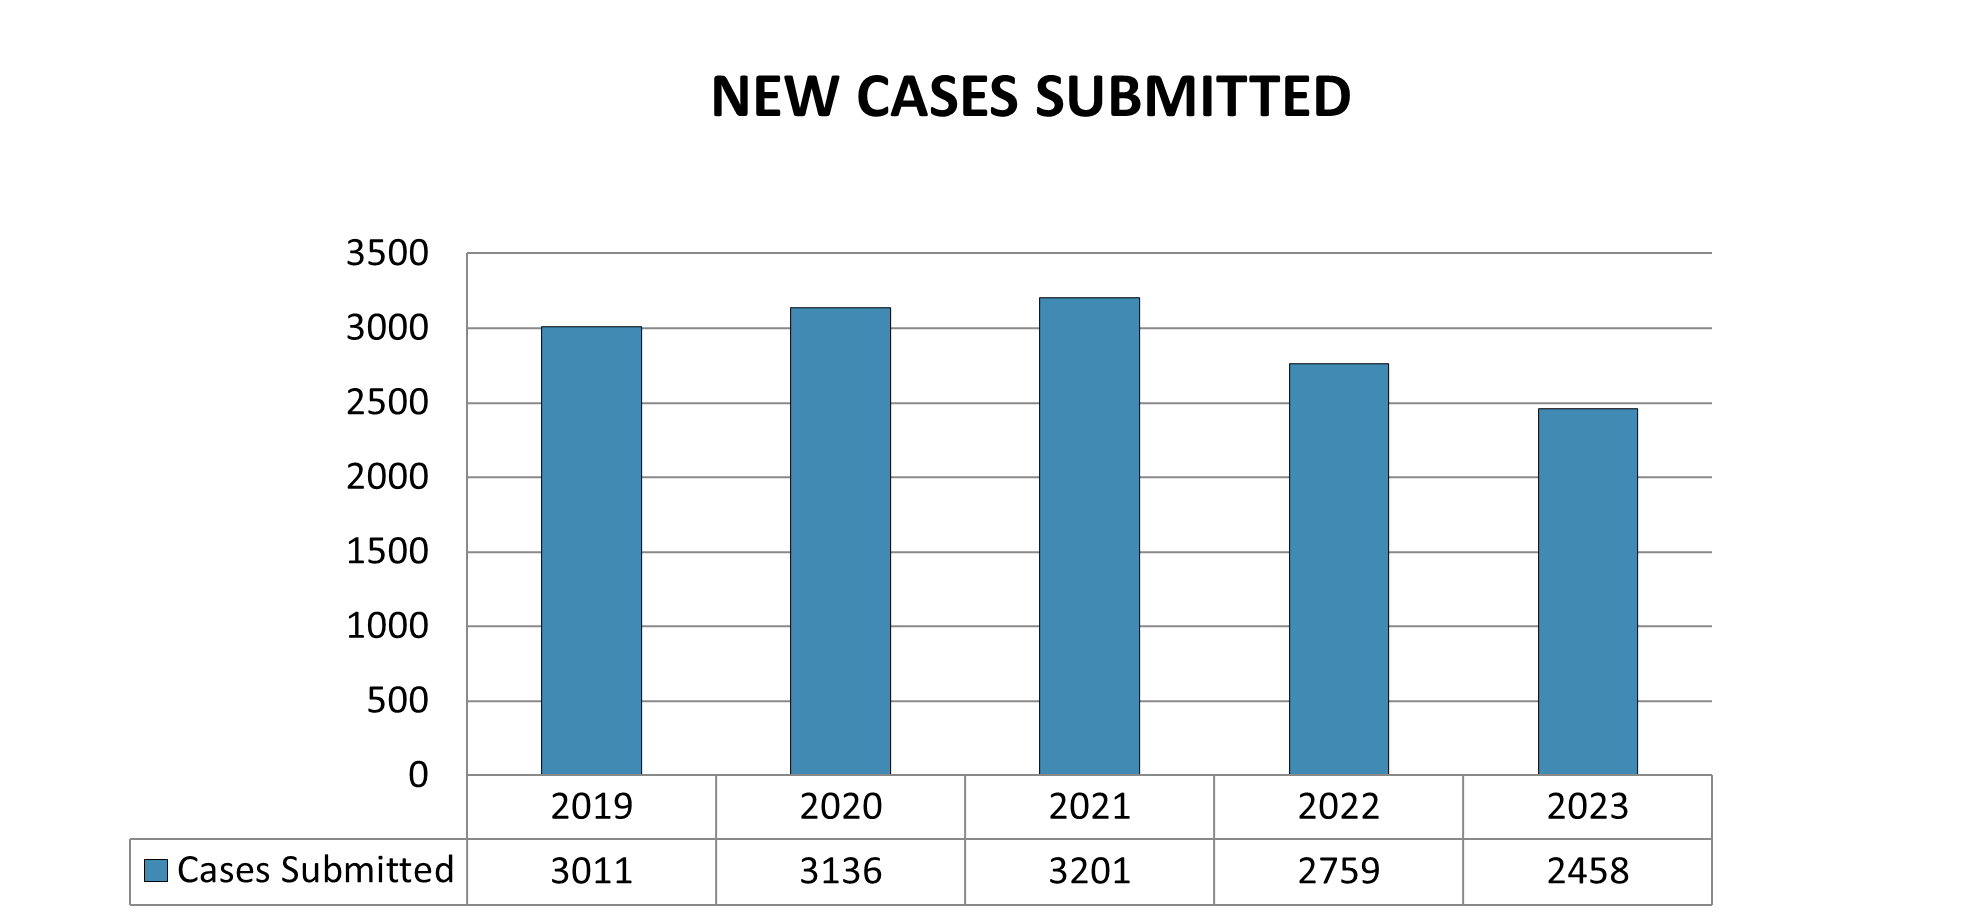
Case Submissions
| 2019 | 2020 | 2021 | 2022 | 2023 | |
|---|---|---|---|---|---|
| Cases Submitted | 3011 | 3136 | 3201 | 2759 | 2458 |
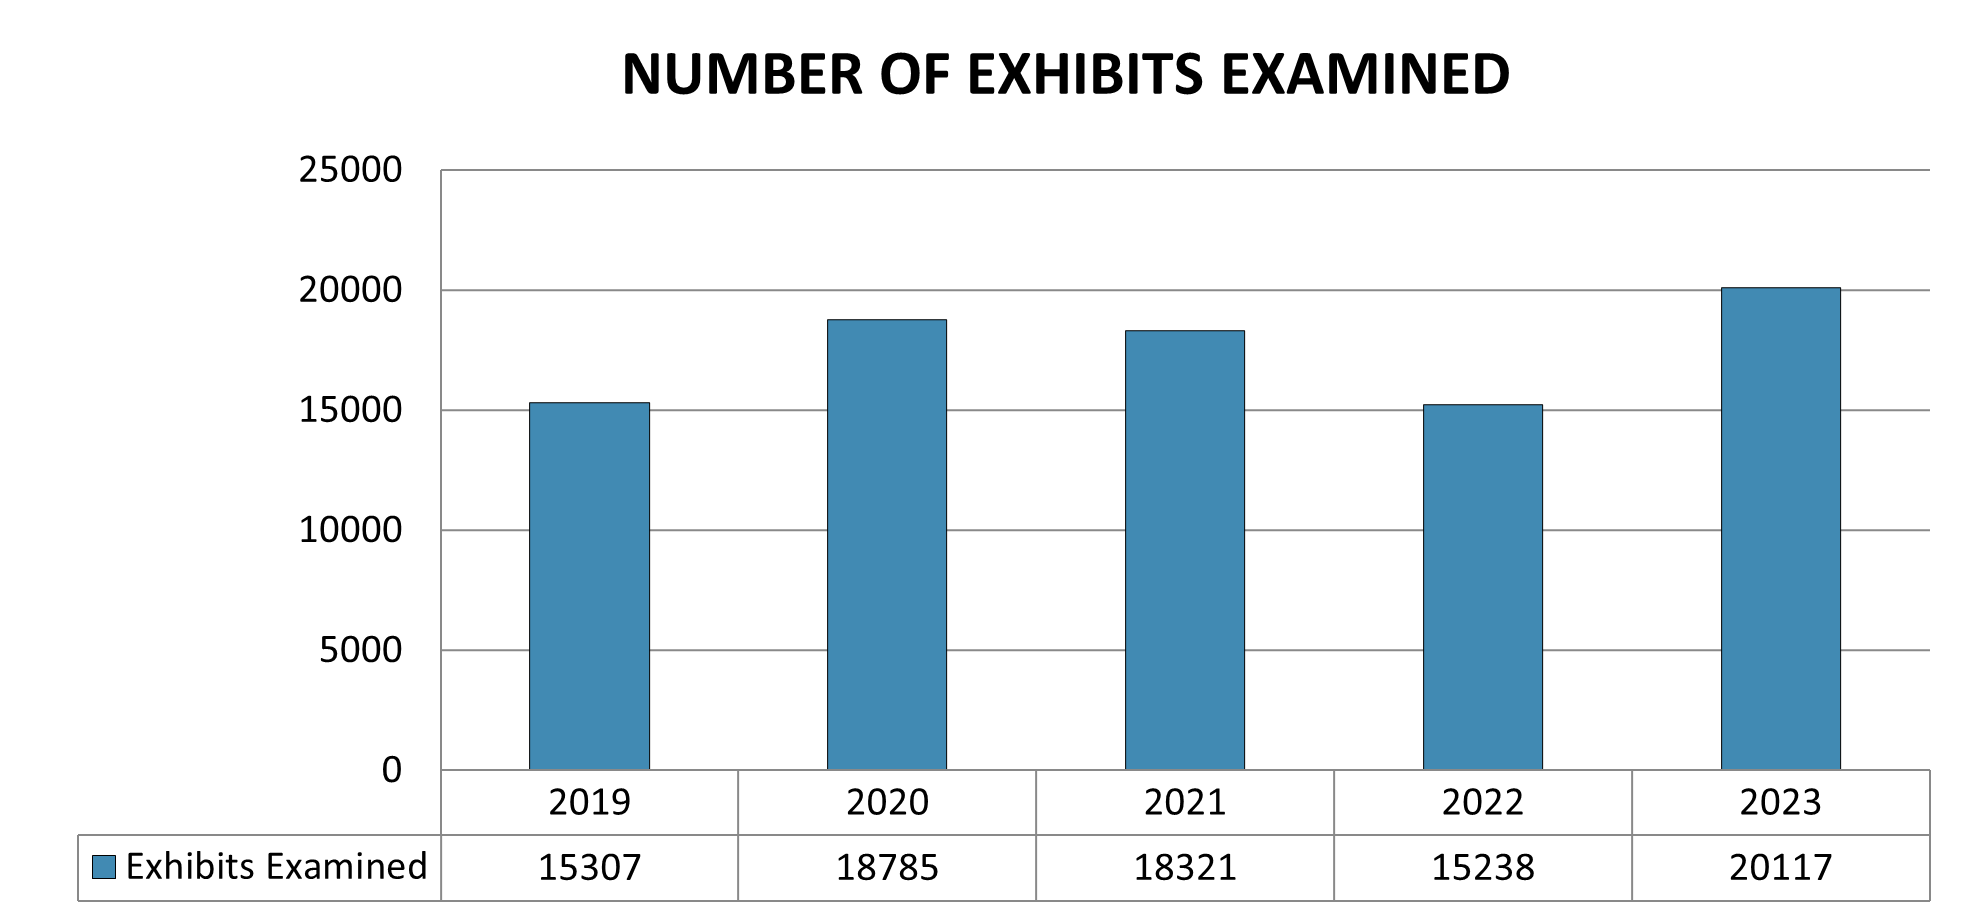
As illustrated in Figure 2, the number of exhibits examined by the Forensic Laboratory was increase approximately 32.0% in 2023 when compared to 2022 and was the highest total in the last 5 years.
| 2019 | 2020 | 2021 | 2022 | 2023 | |
|---|---|---|---|---|---|
| Exhibits Examined | 15307 | 18785 | 18321 | 15238 | 20117 |
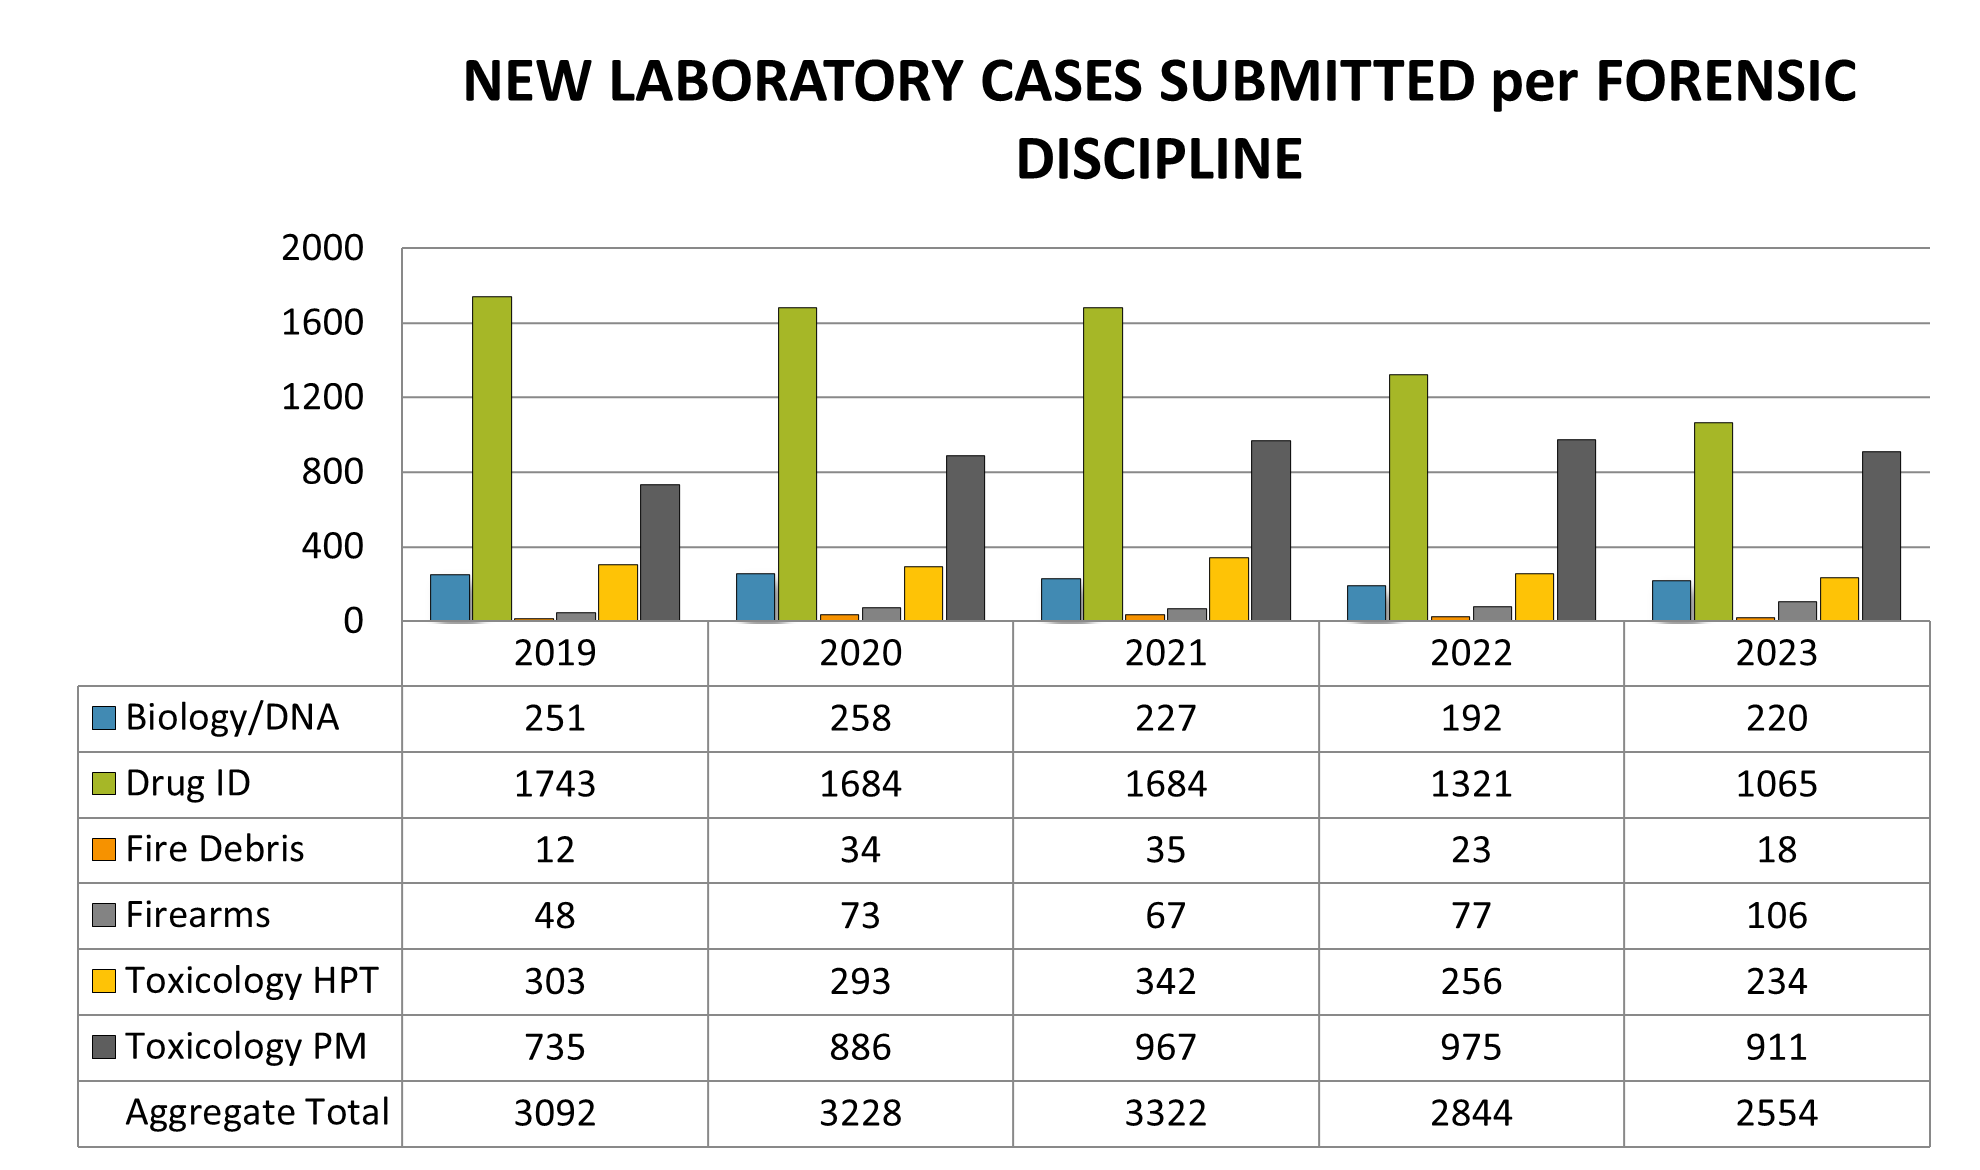
Law enforcement agencies submit criminal cases to the Forensic Laboratory for analysis. Figure 3 illustrates the number of cases submitted to the Forensic Laboratory for the first time each year per laboratory section.
| 2019 | 2020 | 2021 | 2022 | 2023 | |
|---|---|---|---|---|---|
| Biology/DNA | 251 | 258 | 227 | 192 | 220 |
| Drug ID | 1743 | 1684 | 1684 | 1321 | 1065 |
| Fire Debris | 12 | 34 | 35 | 23 | 18 |
| Firearms | 48 | 73 | 67 | 77 | 106 |
| Toxicology HPT | 303 | 293 | 342 | 256 | 234 |
| Toxicology PM | 735 | 886 | 967 | 975 | 911 |
| Aggregate Total | 3092 | 3228 | 3322 | 2844 | 2554 |
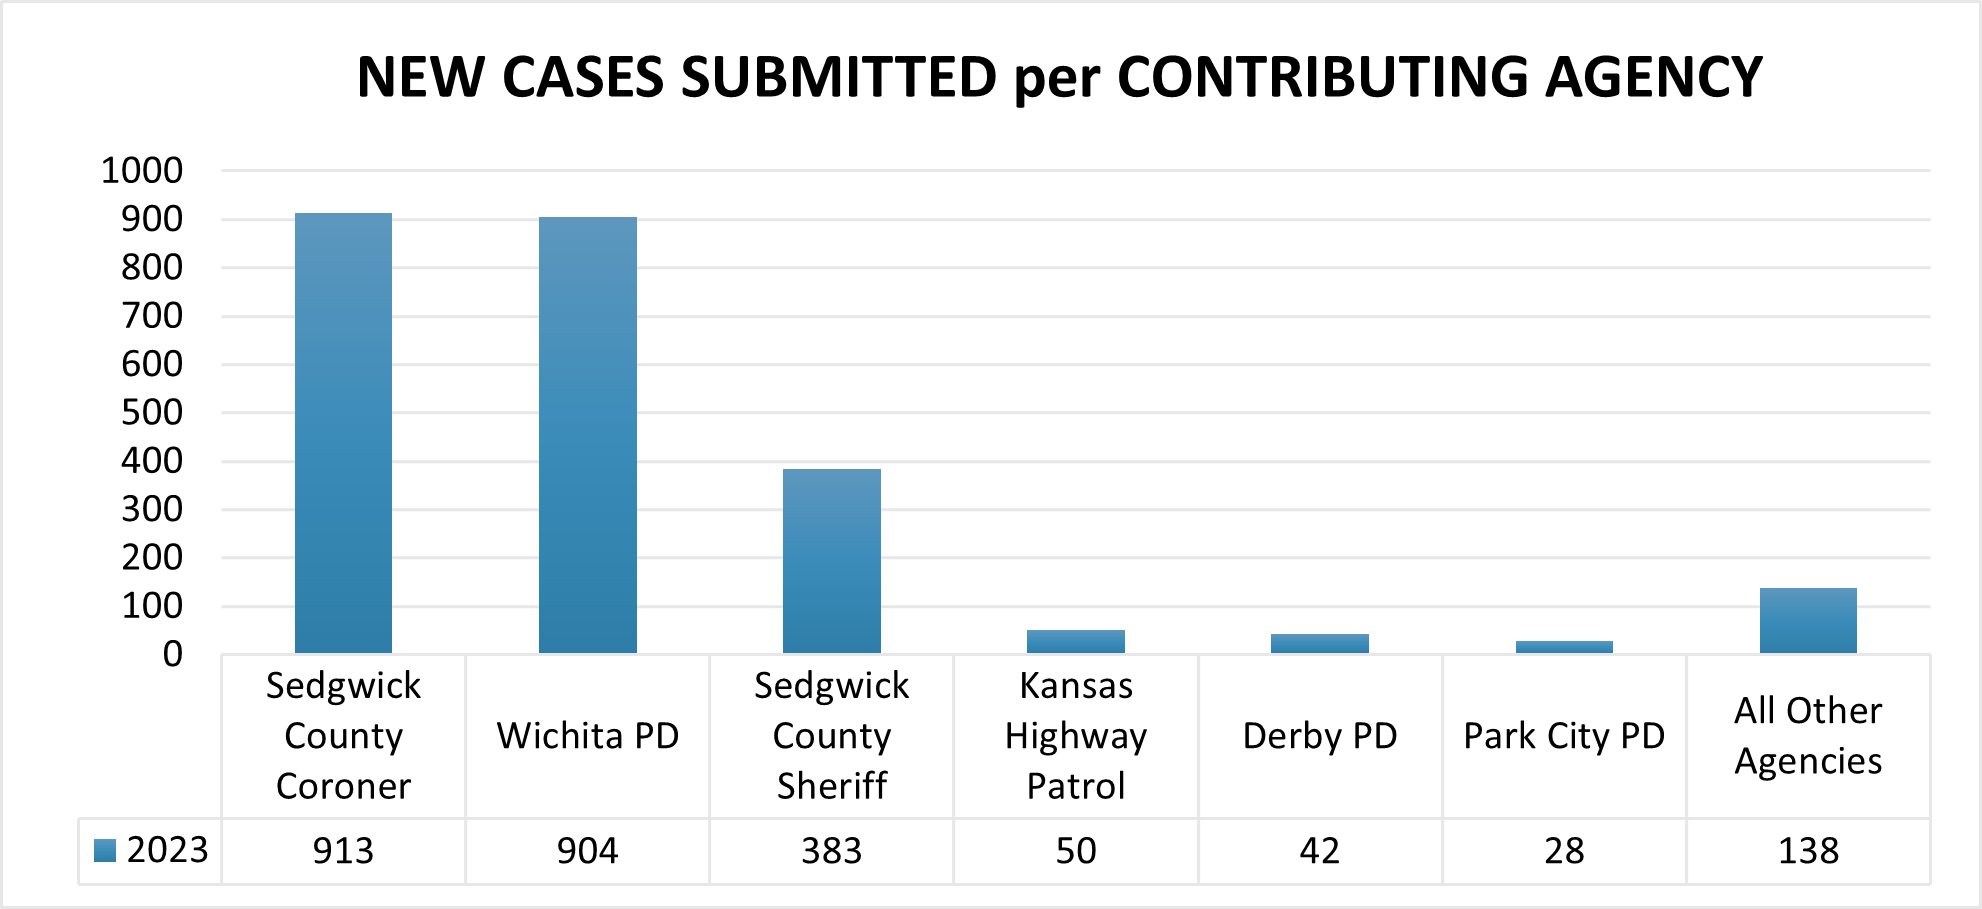
A listing of the agencies that submitted evidence to the laboratory division for forensic analysis and the number of new cases that were submitted by each in 2023 is provided in Figure 4. The District Coroner’s Office submits evidence for analysis in support of the regional autopsy service. Out of county agencies that submit evidence for analysis are subject to a fee schedule set forth by the Sedgwick County Board of County Commissioners.
| Sedgwick County Coroner | Wichita PD | Sedgwick County Sheriff | Kansas Highway Patrol | Derby PD | Park City PD | All Other Agencies | |
|---|---|---|---|---|---|---|---|
| 2023 | 913 | 904 | 383 | 50 | 42 | 28 | 138 |
Cases are submitted for forensic examination under five analytical disciplines, Biology / DNA, Drug ID, Firearms, Fire Debris, and Toxicology (postmortem and antemortem [HPT]). Toxicology receives antemortem evidence from law enforcement and postmortem specimens from the District Coroner.
The number of case submissions associated with each laboratory is illustrated in Table 1. The aggregate submission count of 2658 includes all submissions from contributing agencies, which includes submissions from the aggregated 2554 new cases (the sum of all new cases submitted to each laboratory) generated in year 2023 (see Figure 3) and submissions from cases generated in previous years in support of on-going investigations by law enforcement.
| Laboratory | 2023 Aggregate Case Submissions Count |
|---|---|
| Biology/DNA | 263 |
| Drug ID | 1118 |
| Firearms | 110 |
| Fire Debris | 18 |
| Toxicology Antemortem | 235 |
| Toxicology Postmortem | 914 |
| Sum of Submission Count | 2658 |
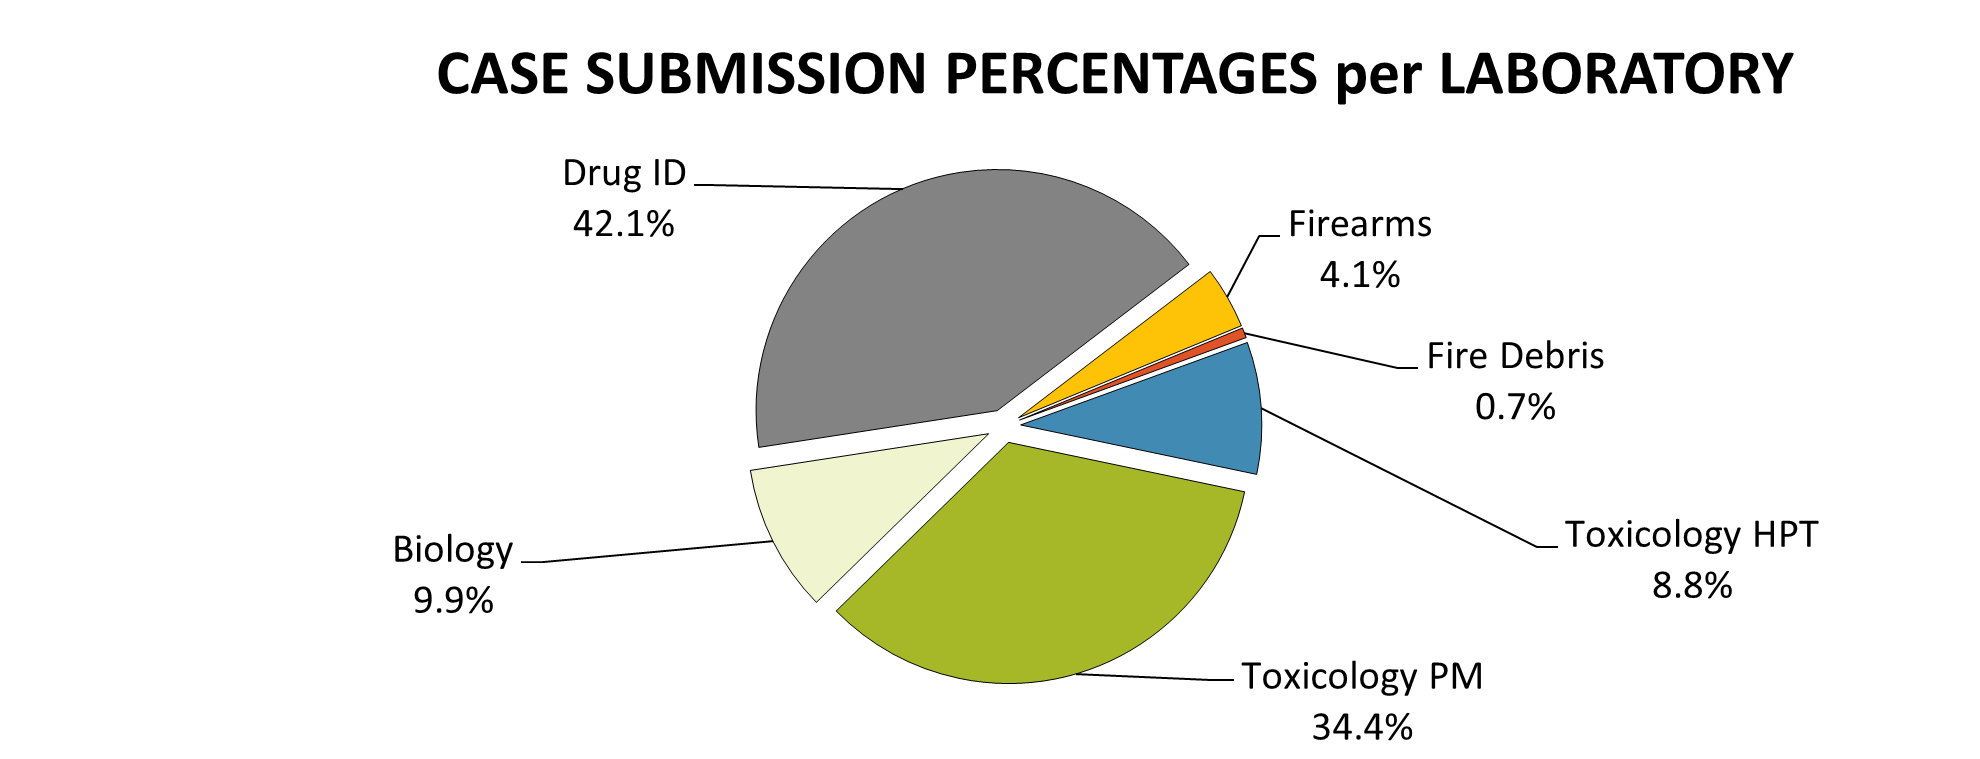
The relative percentage of cases submitted to each laboratory section is illustrated in Figure 5. The Drug Identification Laboratory continues to receive the majority of evidence submitted, followed by submissions to the Toxicology Laboratory, which in 2023, had all-time highs for postmortem case submissions.
| Laboratory | Case Submission Percentages |
|---|---|
| Biology/DNA | 9.9 |
| Drug ID | 42.1 |
| Firearms | 4.1 |
| Fire Debris | 0.7 |
| Toxicology Antemortem | 8.8 |
| Toxicology Postmortem | 34.4 |
Backlog
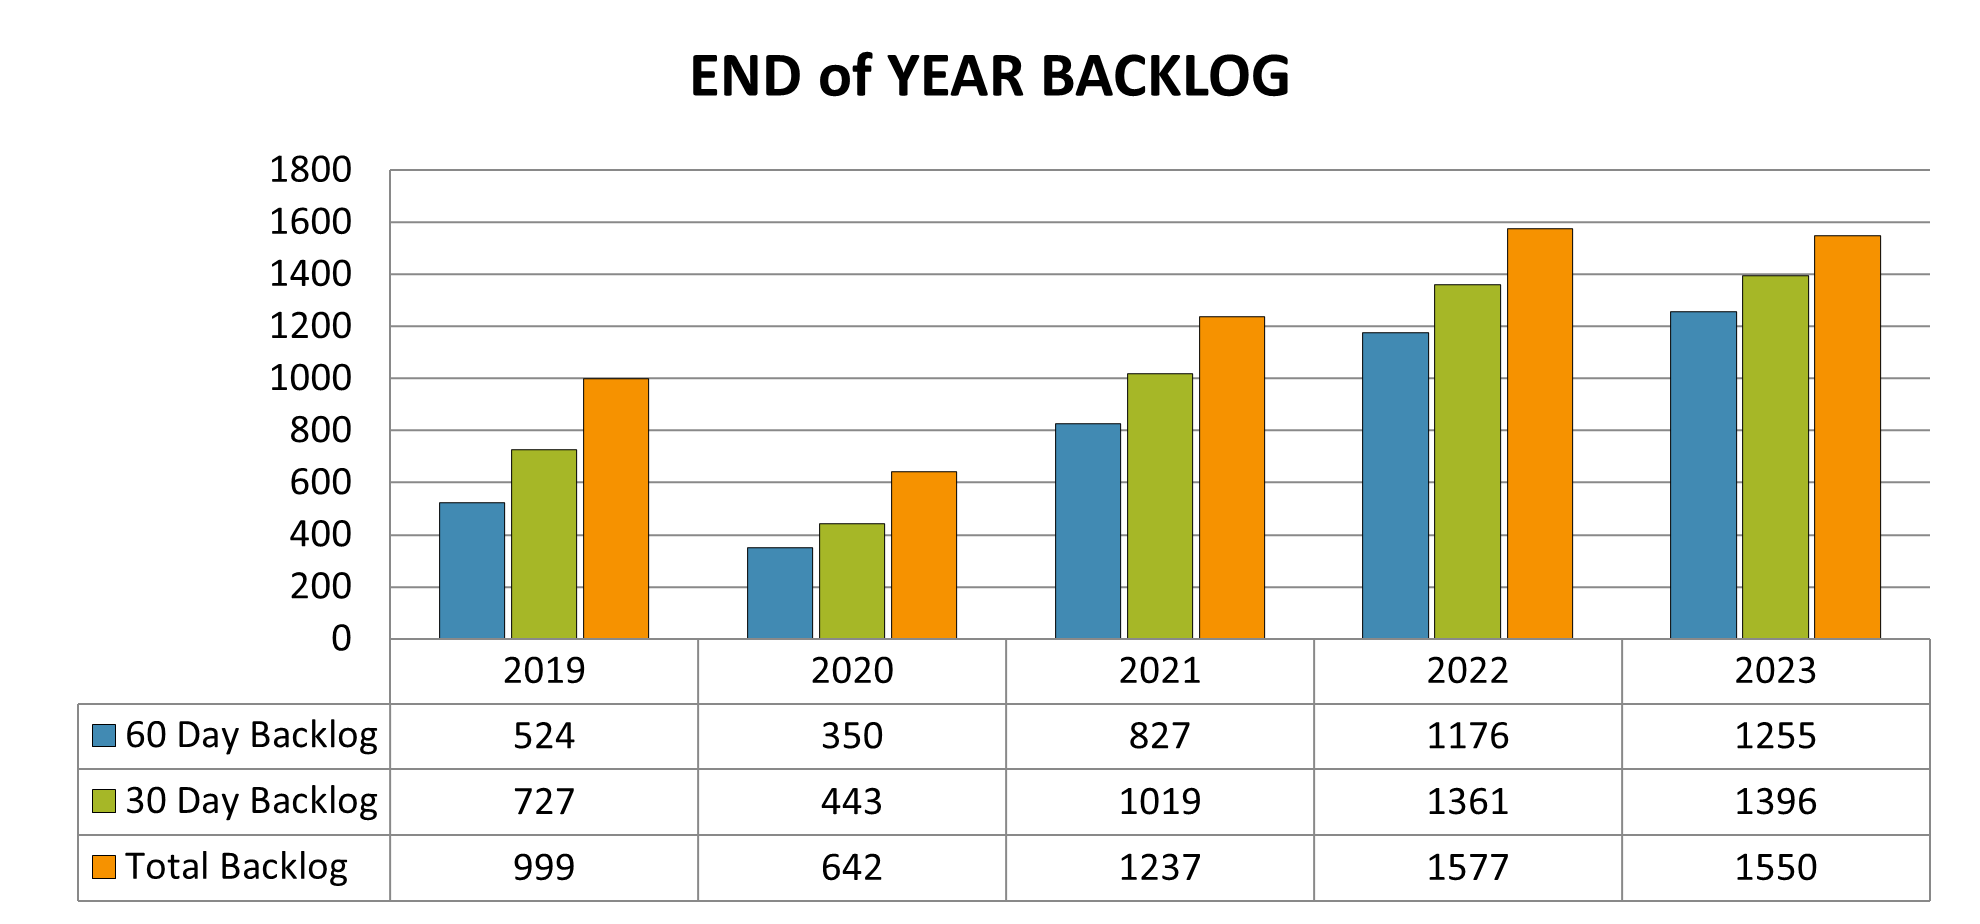
Nationally, the target turn-around time for case completion is 30 days from submission. The Forensic Laboratory has set an internal goal of 60 days, which is acceptable to the vast majority of our contributors according to annual contributor surveys. As of December 31, 2023 the Forensic Laboratories had a 60 day backlog of 1255 cases and a 30 day backlog of 1396 cases (see Figure 6).
| 2019 | 2020 | 2021 | 2022 | 2023 | |
|---|---|---|---|---|---|
| 60 Day Backlog | 524 | 350 | 827 | 1176 | 1255 |
| 30 Day Backlog | 727 | 443 | 1019 | 1361 | 1396 |
| Total Backlog | 999 | 672 | 1237 | 1577 | 1550 |
Expert Testimony
The professional staff is frequently called upon to present expert testimony in court. The amount of time spent by staff preparing for testimony, waiting to testify at courthouses, and on the stand providing testimony is significant.
In 2023, the Forensic Science Laboratories received 494 subpoenas for court appearances. This resulted in laboratory staff appearing in court to provide expert testimony in 44 criminal cases.
Agencies Served
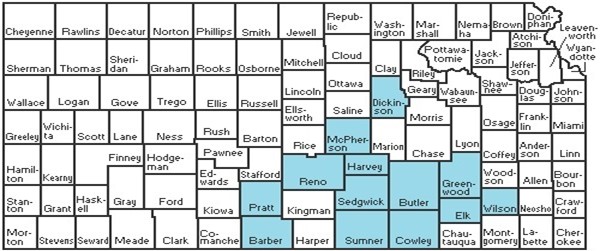
The Forensic Science Laboratory provides expert testing services and consultation for a variety of law enforcement agencies within and outside of Sedgwick County. In 2023, the Forensic Science Laboratory provided expert testing services and consultations to 40 law enforcement agencies, fire departments, and district coroners. In Figure 7, the shaded counties indicate jurisdictions within the state for which forensic laboratory services were provided.
Sedgwick County vs. Out-of-County Cases
The Regional Forensic Science Center serves as the principle forensic (crime) laboratory for all Sedgwick County law enforcement agencies and provides forensic services to many other counties and municipalities within the state of Kansas; however, the vast majority of forensic laboratory services were provided for Sedgwick County law enforcement agencies and the Sedgwick County Coroner. A significant portion of the out-of-county casework was in support of the District Coroner’s out-of-county autopsies. Municipalities and counties served in 2023 are listed in Table 2.
| Barber County Coroner | Goddard USD265 Police Department | Pratt County Coroner |
| Bel Aire Police Department | Greenwood County Coroner | Reno County Coroner |
| Bentley Police Department | Haysville Police Department | Sedgwick County Coroner |
| Bureau of Alcohol, Tobacco, Firearms and Explosives (ATF) | Harvey County Coroner | Sedgwick County Courthouse Police Department |
| Butler County Coroner | Kansas Department of Corrections | Sedgwick County Fire Department |
| Butler County Sheriff's Office | Kansas Highway Patrol | Sedgwick County Sheriff's Office |
| Cowley County Coroner | Kechi Police Department | Sumner County Coroner |
| Derby Police Department | Maize Police Department | United States Probation |
| Dickinson County Coroner | Marion County Coroner | Valley Center Police Department |
| Drug Enforcement Agency (DEA) | McPherson County Coroner | Wichita Fire Department |
| Elk County Coroner | Mount Hope Police Department | Wichita Police Department |
| Garden Plain Police Department | Mulvane Police Department | Wichita State University Police Department |
| Goddard Police Department | Park City Police Department | Wilson County Coroner |
Cases Completed
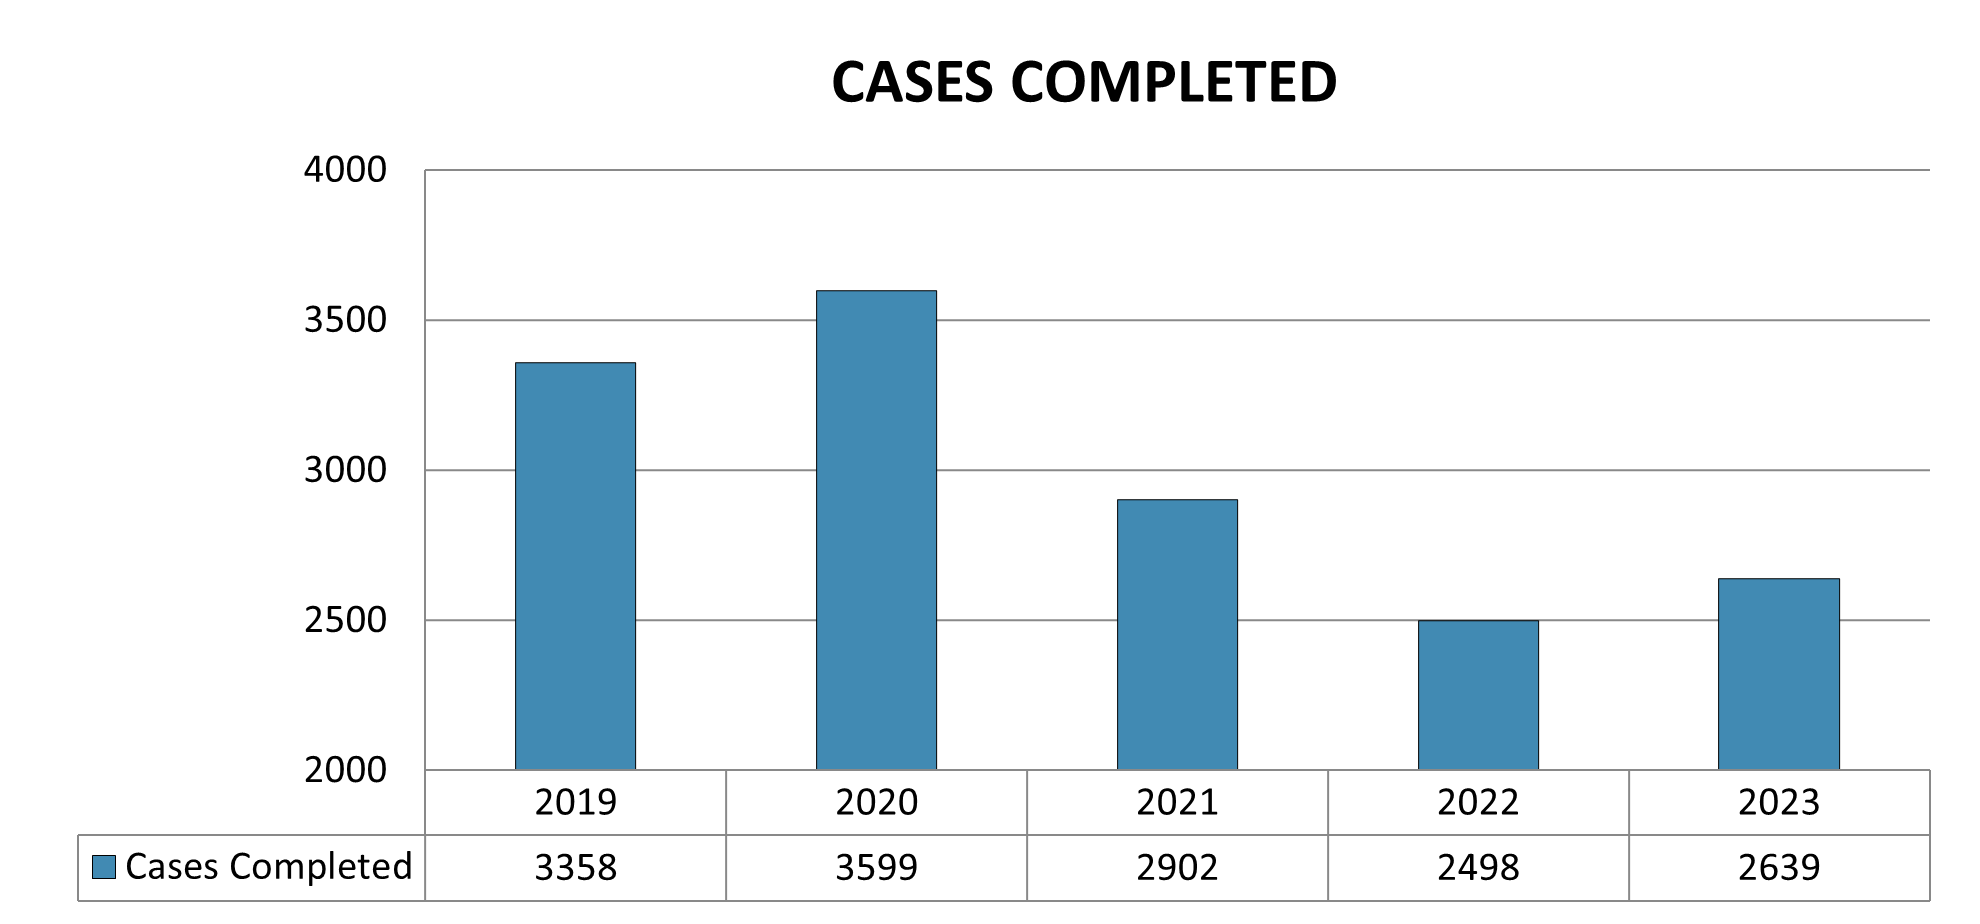
Cases completed every year may include cases that are submitted for the first time that year, or backlogged cases from previous years, or they may be cases that were originally submitted in previous years but have additional examination(s) requested. Figure 8 illustrates the number of cases completed by the Forensic Science Laboratories in the given year.
The Forensic Laboratory has faced staffing challenges throughout the past five years. This was especially true for the Firearms, Drug Identification, and Toxicology Laboratories, which accounts for a drop in the number of cases completed for these years.
| 2019 | 2020 | 2021 | 2022 | 2023 | |
|---|---|---|---|---|---|
| Cases Completed | 3358 | 3599 | 3902 | 3498 | 2639 |
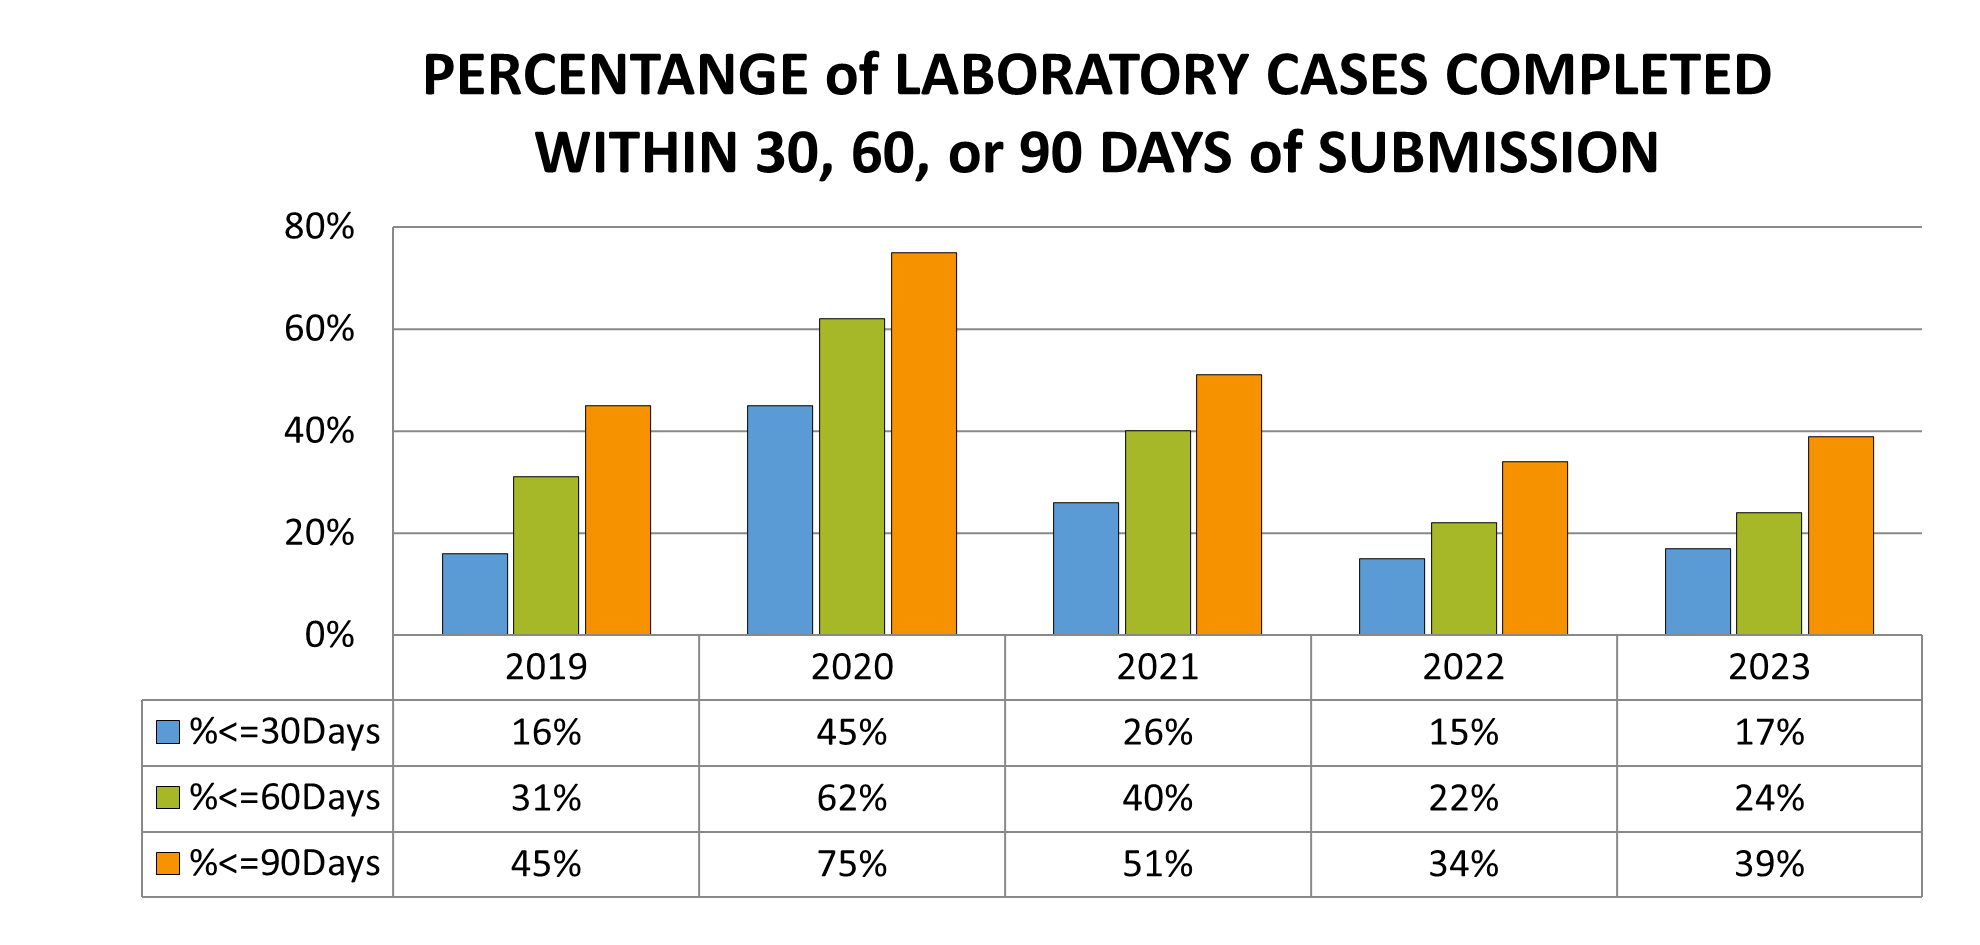
One metric of the Forensic Laboratory casework output is the amount of time it takes for a case to be completed following submission. As illustrated in Figure 9, 24% of cases submitted to the Laboratory Division in 2023 were completed within 60 days of submission.
| 2019 | 2020 | 2021 | 2022 | 2023 | |
| %<=30Days | 16 | 45 | 26 | 15 | 17 |
| %<=60Days | 31 | 62 | 40 | 22 | 24 |
| %<=90Days | 45 | 75 | 51 | 34 | 39 |
Criminalistics
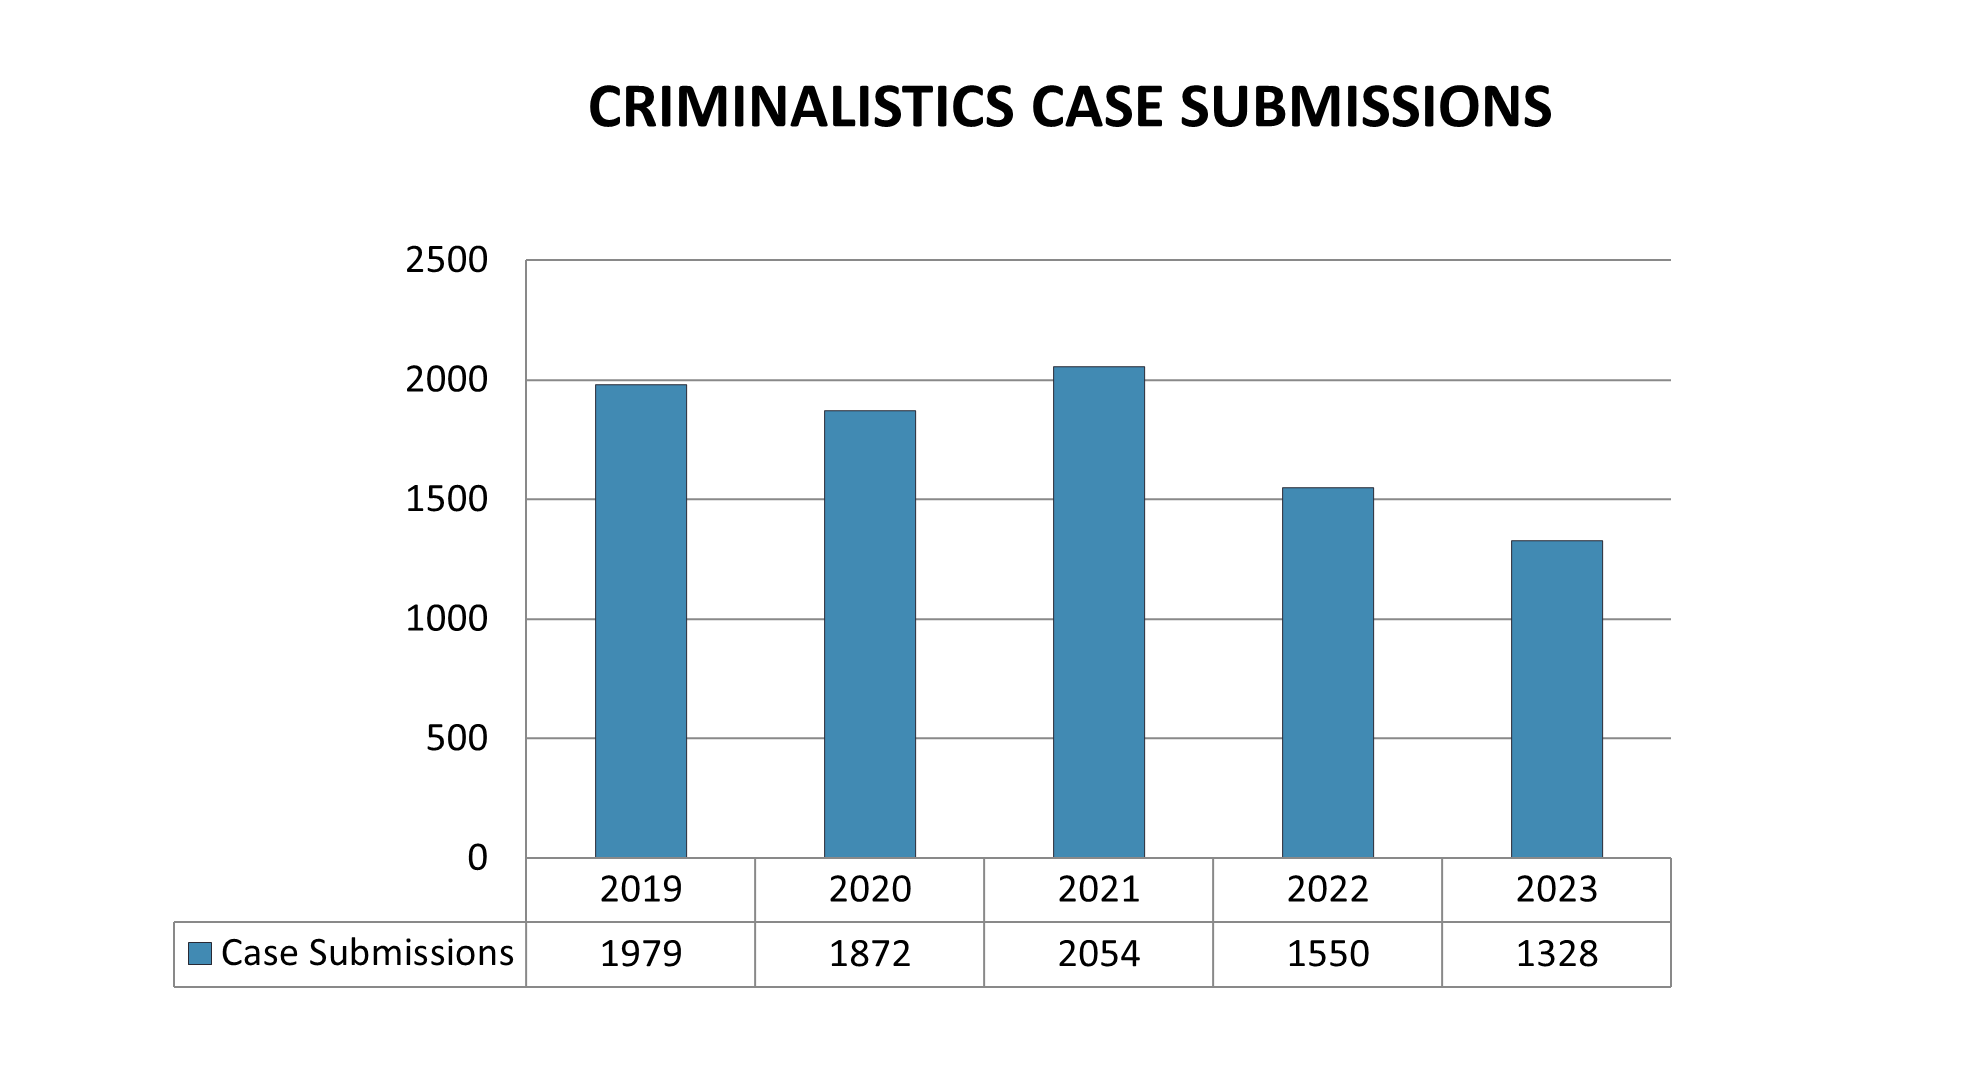
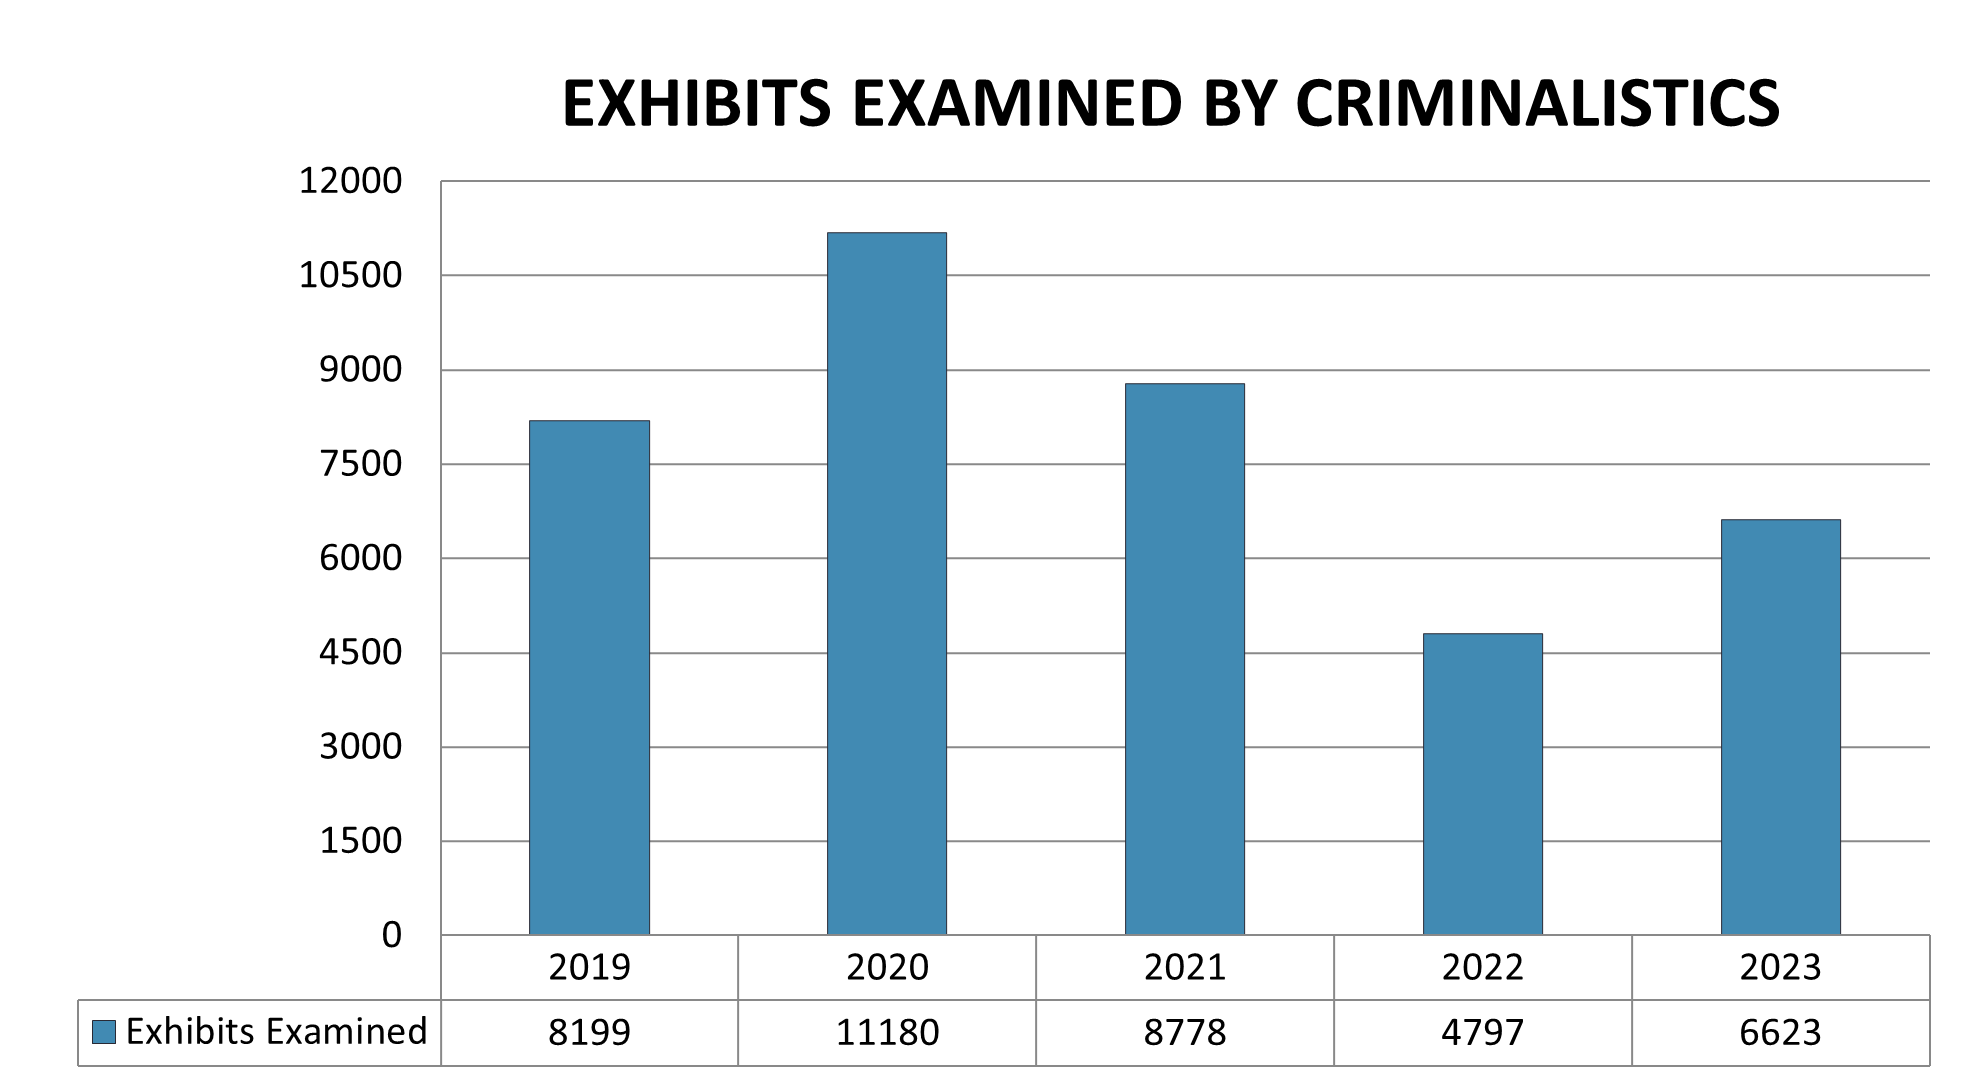
The Criminalistics Unit receives the majority of the cases submitted to the Forensic Science Laboratories. The Criminalistics Unit provides forensic examinations in Drug Identification, Firearms, and Fire Debris. Figure 10 illustrates the trend in forensic case volume submitted to the Criminalistics Unit, and Figure 11 illustrates the number of exhibits examined by the Criminalistics Unit.
| 2019 | 2020 | 2021 | 2022 | 2023 | |
|---|---|---|---|---|---|
| Case Submissions | 1979 | 1872 | 2054 | 1550 | 1328 |
| 2019 | 2020 | 2021 | 2022 | 2023 | |
|---|---|---|---|---|---|
| Exhibits Examined | 8199 | 11180 | 8778 | 4797 | 6623 |
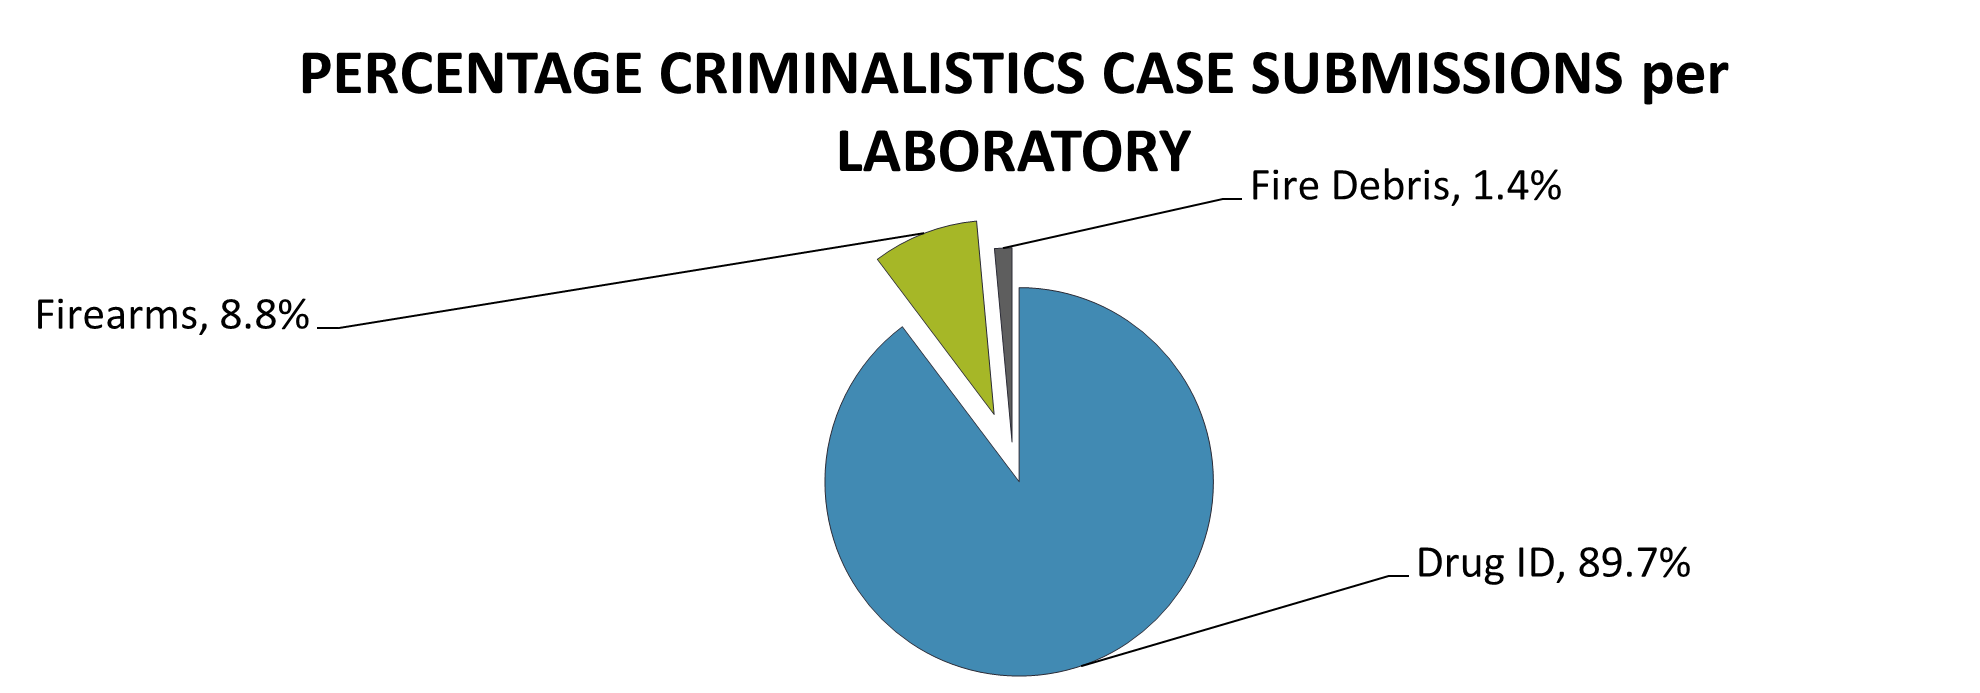
The volume and percentage of cases submitted to each laboratory of the criminalistics section is illustrated in Figure 12.
| Laboratory | Percentage of Submissions |
|---|---|
| Drug ID | 89.7 |
| Firearms | 8.8 |
| Fire Debris | 1.4 |
Drug ID
Examination requests for the identification of illicit drugs accounted for approximately 90% of the cases submitted to Criminalistics, as depicted in Figure 12 above.
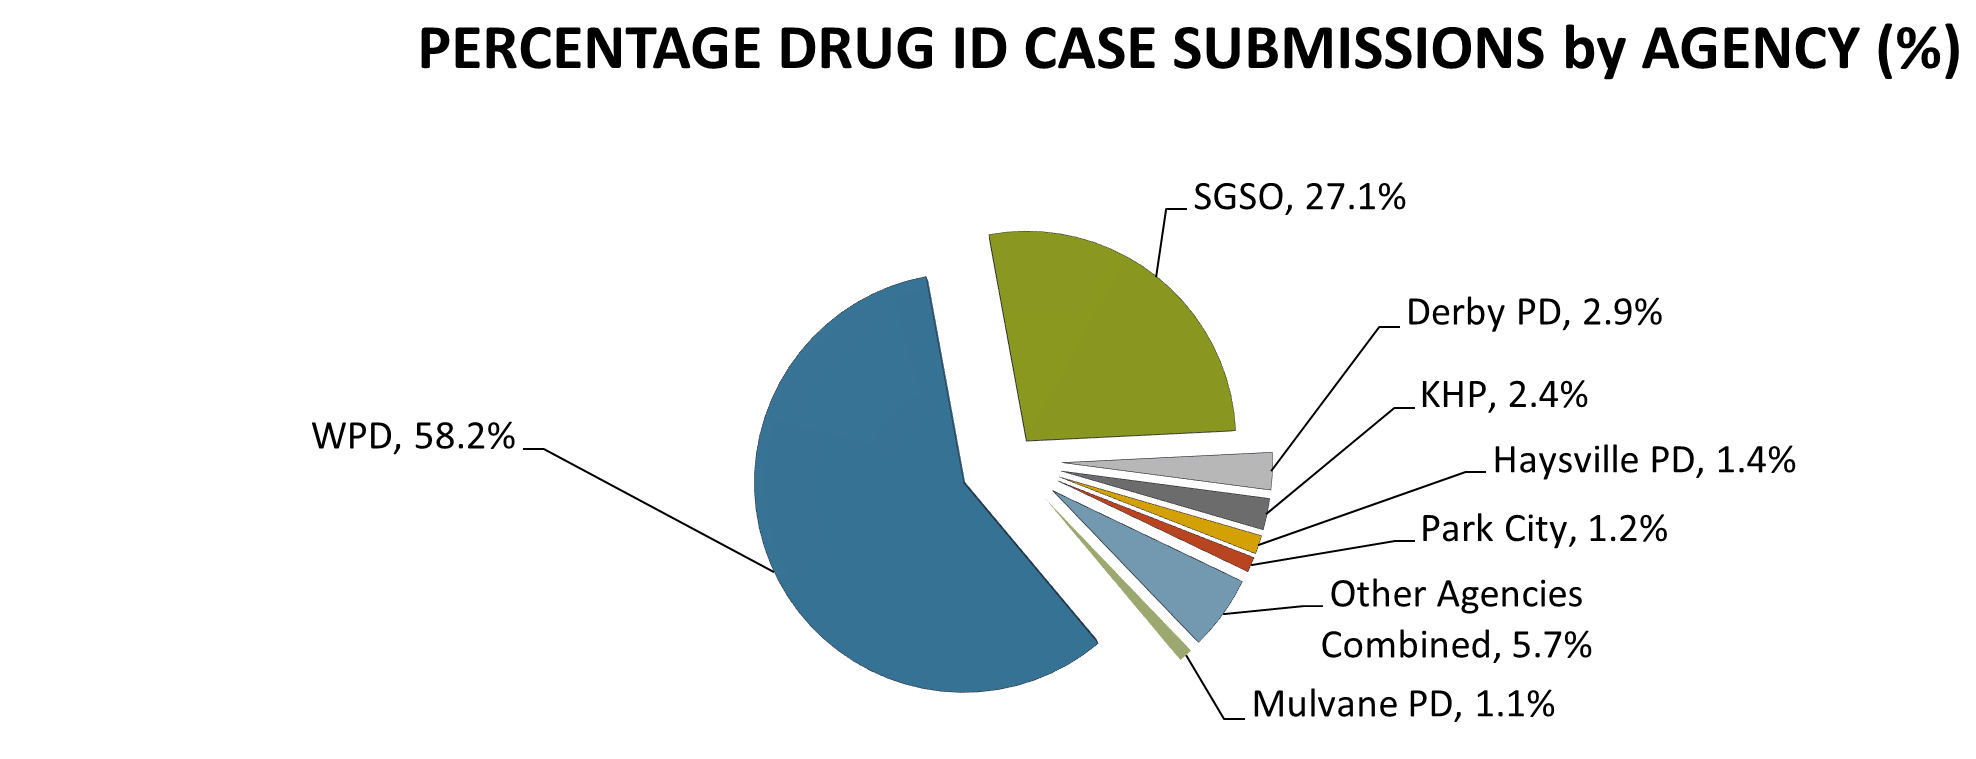
The agency that submits the greatest volume of evidence to Drug ID is the Wichita Police Department (WPD). This is apparent in Figure 13, as nearly 68% of cases received are from WPD. Agencies other than WPD and the Sedgwick County Sheriff’s Office (SGSO) are responsible for approximately 15% of the total cases submitted.
| Agency | Percentage of Case Submissions |
|---|---|
| Wichita Police Department | 58.2 |
| Sedgwick County Sheriffi's Office | 27.1 |
| Derby Police Department | 2.9 |
| Kansas Highway Patrol | 2.4 |
| Haysville Police Department | 1.4 |
| Park City Police Department | 1.2 |
| Mulvane Police Department | 1.1 |
| Other Agencies Combined | 5.7 |
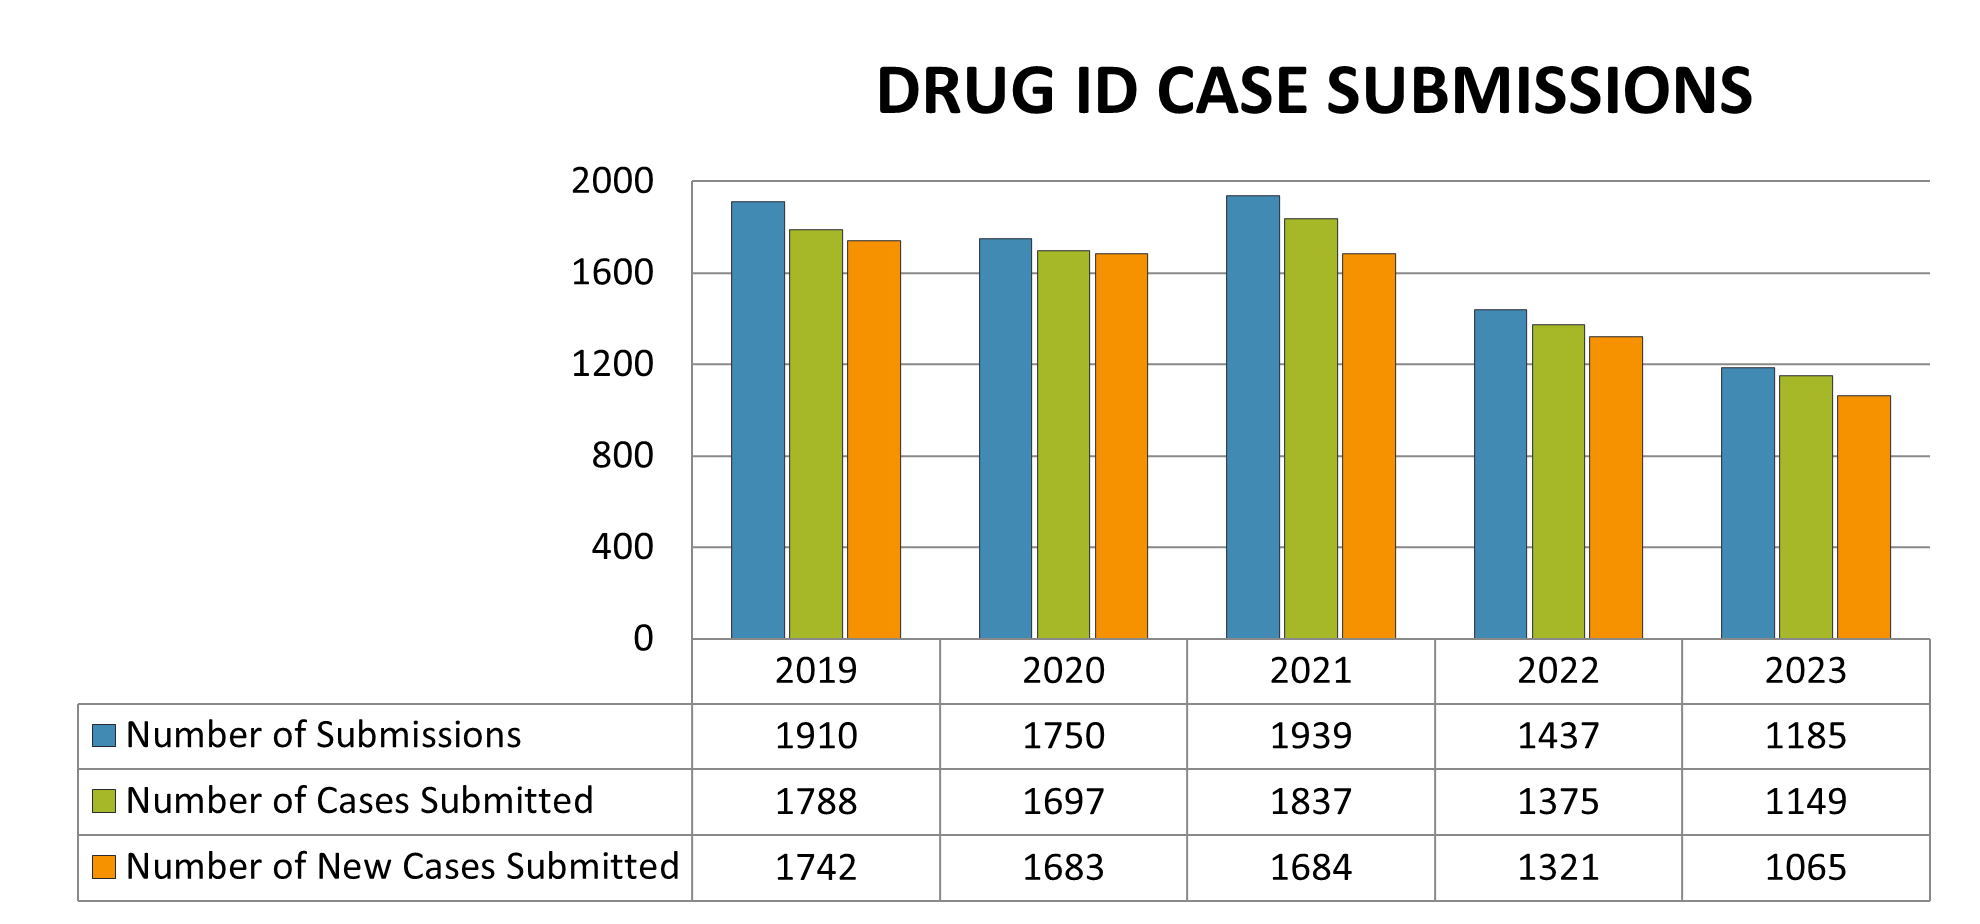
The number of submissions, the number of cases submitted, and the number of new cases submitted to the Drug ID Laboratory over the last five years is illustrated in Figure 14.
| 2019 | 2020 | 2021 | 2022 | 2023 | |
|---|---|---|---|---|---|
| Number of Submissions | 1910 | 1750 | 1939 | 1437 | 1185 |
| Number of Cases Submitted | 1788 | 1697 | 1837 | 1375 | 1149 |
| Number of New Cases Submitted | 1742 | 1683 | 1683 | 1321 | 1065 |
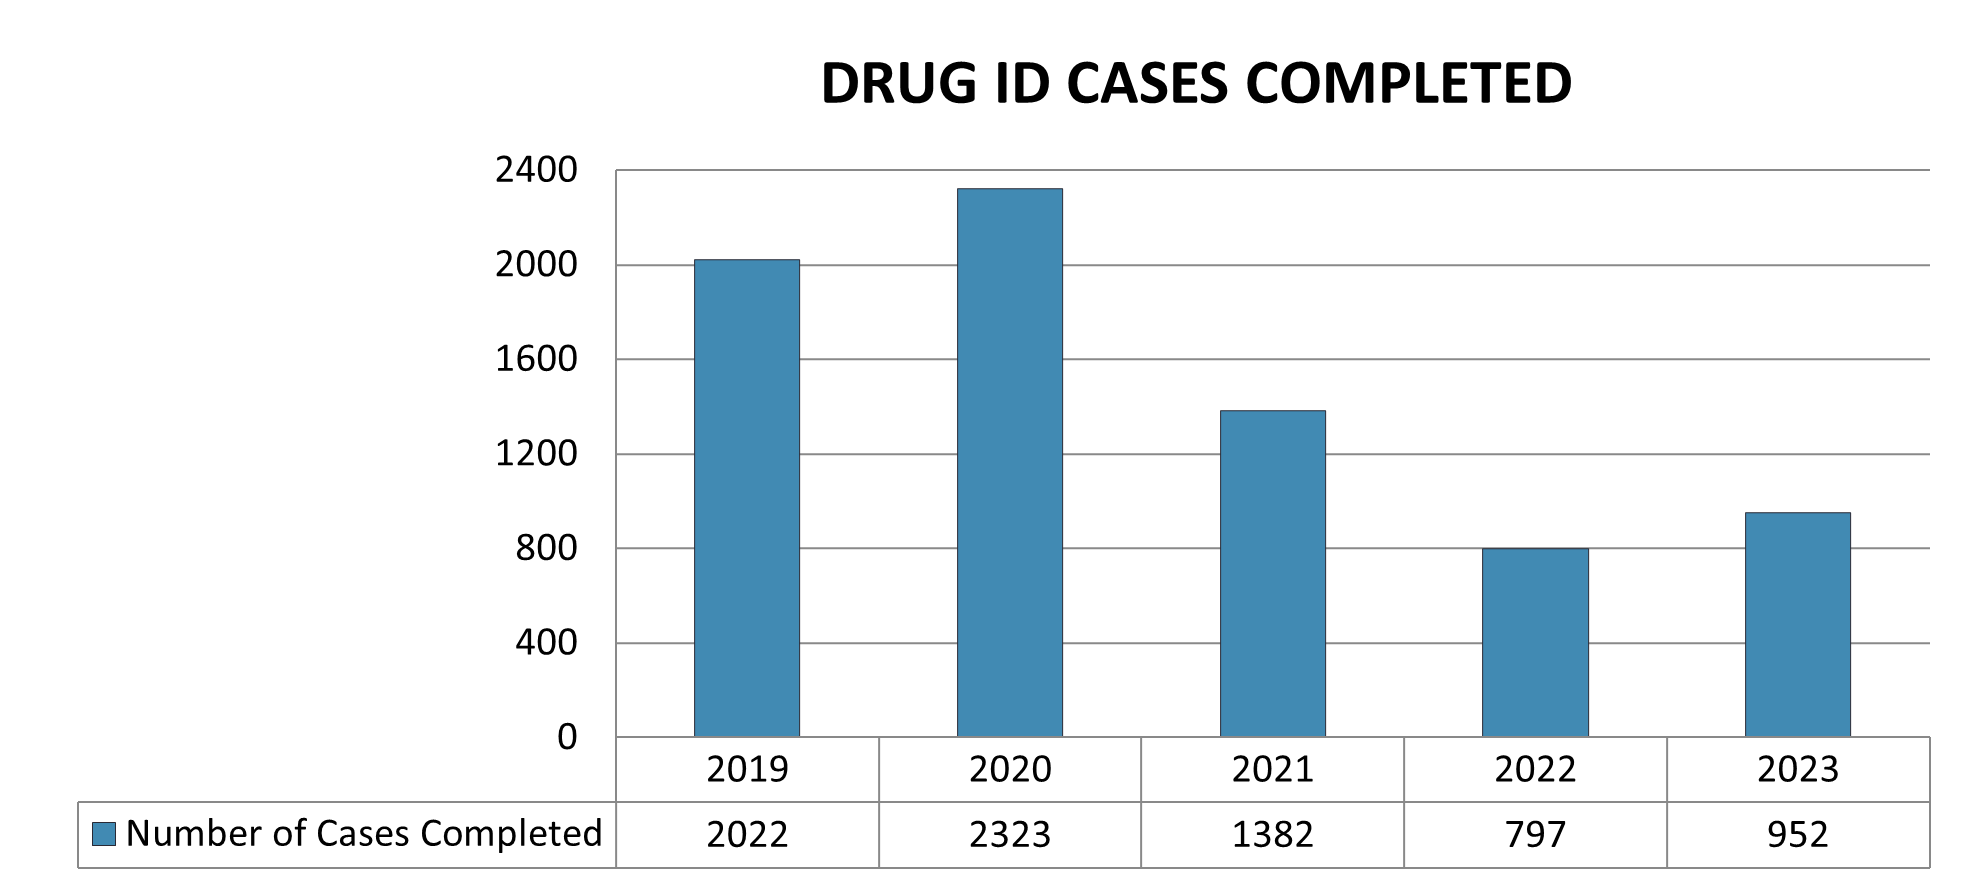
The number of cases completed by the Drug Identification Laboratory over the last 5 years is illustrated in Figure 15.
Below is drug trend information on several key drugs that were noted as a result of analysis by the RFSC Drug Identification Laboratory. Of interest were the trends observed during analysis of fentanyl, methamphetamine, cocaine, tetrahydrocannabinol, clonazolam, and eutylone.
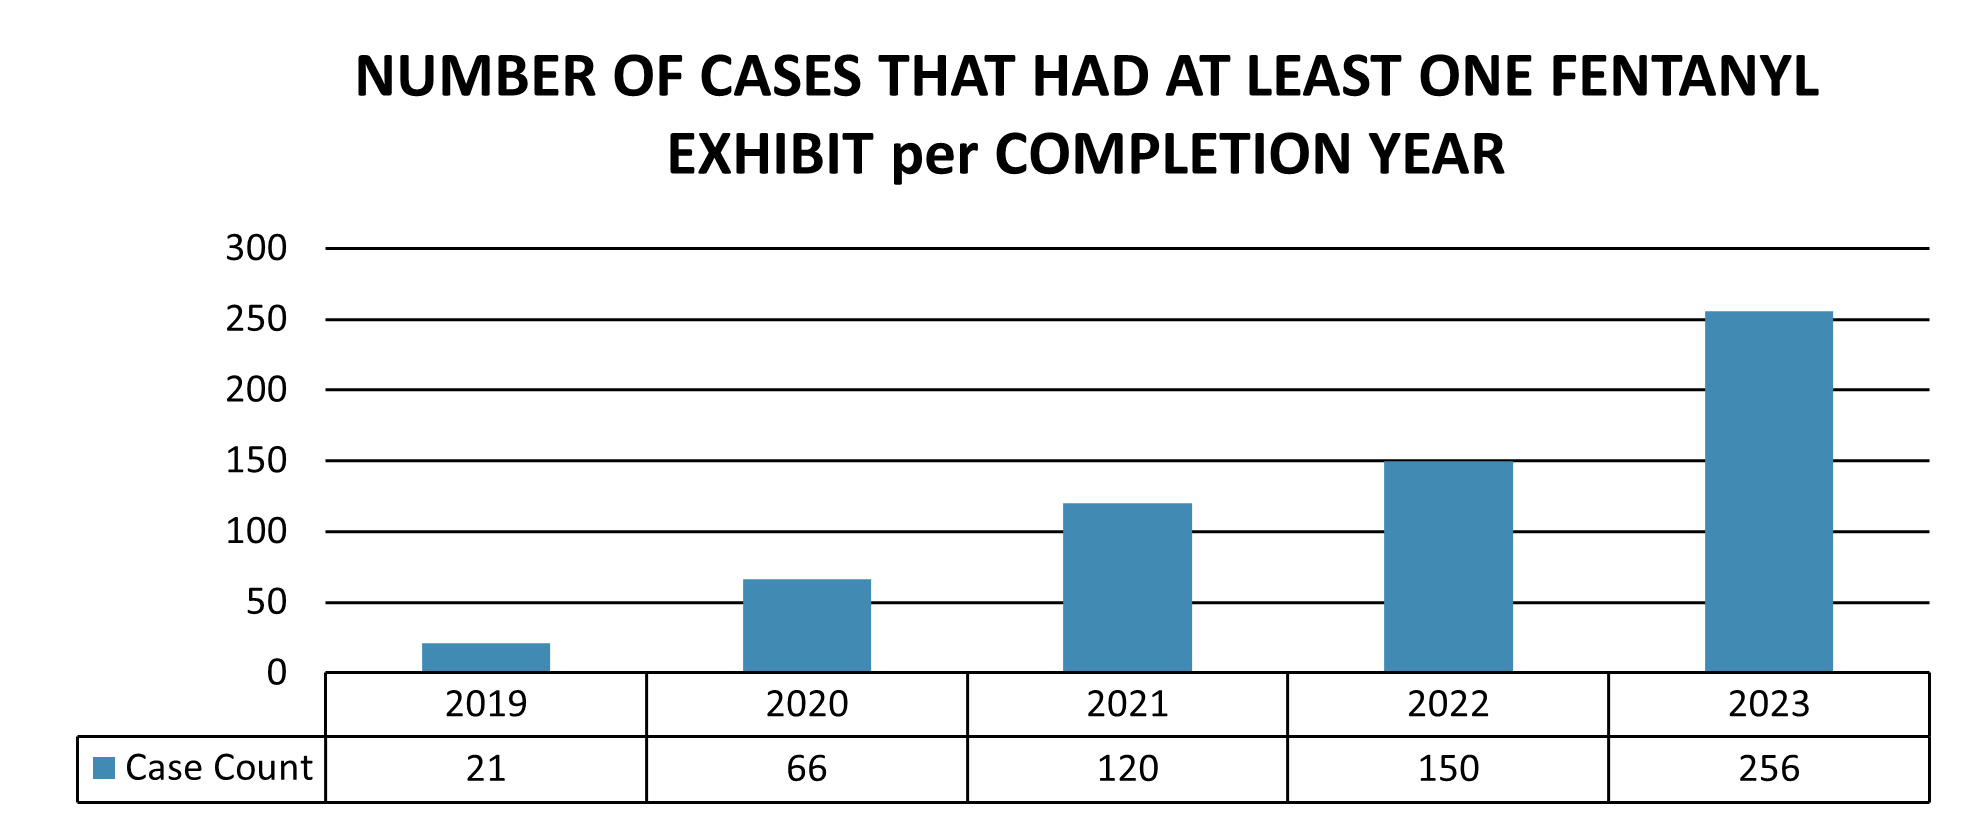
As illustrated in Figure 16 the number of cases examined that had fentanyl detected increased from 21 in 2019 to 256 in 2023, which equates to an approximate 1,119% increase. Additionally, for the 952 cases completed in 2023, approximately 27% of them had at least 1 fentanyl positive exhibit.
| 2019 | 2020 | 2021 | 2022 | 2023 | |
|---|---|---|---|---|---|
| Case Count | 21 | 66 | 120 | 150 | 256 |
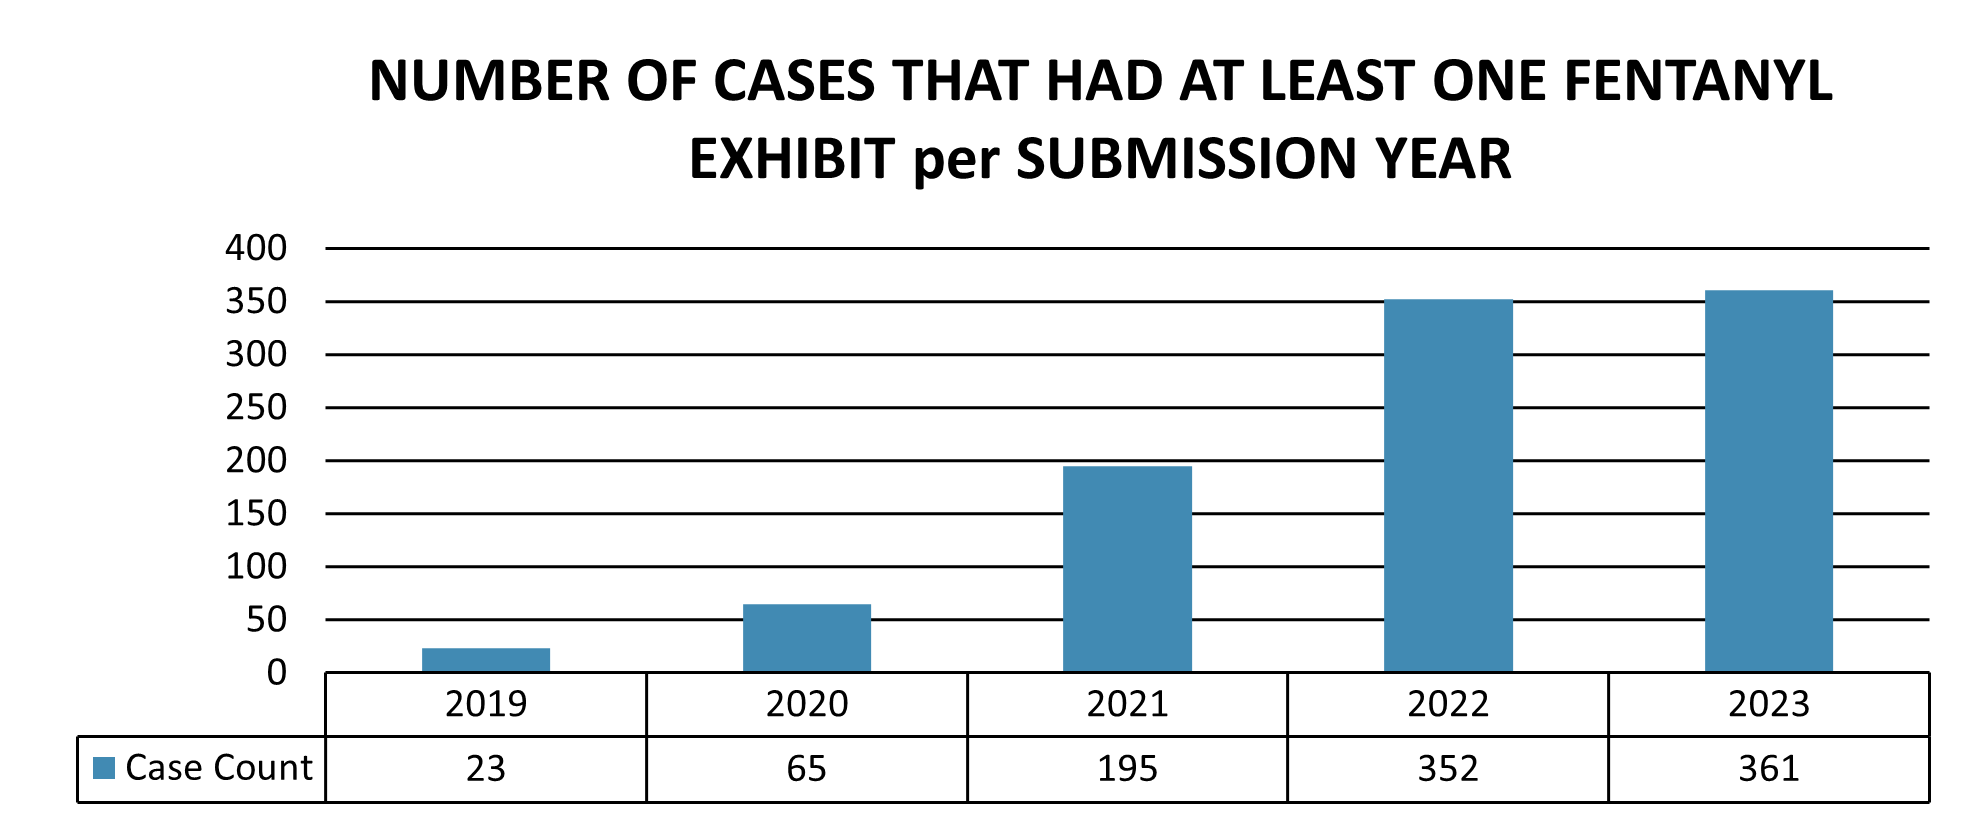
As illustrated in Figure 17 the number of cases testing positive for fentanyl submitted has increased from 23 in 2019 to at least 361 in 2023, which equates to an approximate 1,469% increase. Additionally, for the 1118 cases submitted in 2023 approximately 32.2% of them had at least 1 fentanyl positive exhibit.
| 2019 | 2020 | 2021 | 2022 | 2023 | |
|---|---|---|---|---|---|
| Case Count | 23 | 65 | 195 | 352 | 361 |
Methamphetamine is a highly addictive stimulant drug with a high risk for dependence. It can cause irregular heartbeat, delirium, panic, psychosis, and heart failure. It is a synthetic drug that takes the form of a white, odorless, bitter-tasting crystalline powder that easily dissolves in water or alcohol. It has more rapid and lasting effects than amphetamine, used illegally as a stimulant and as a prescription drug to treat narcolepsy and maintain blood pressure.
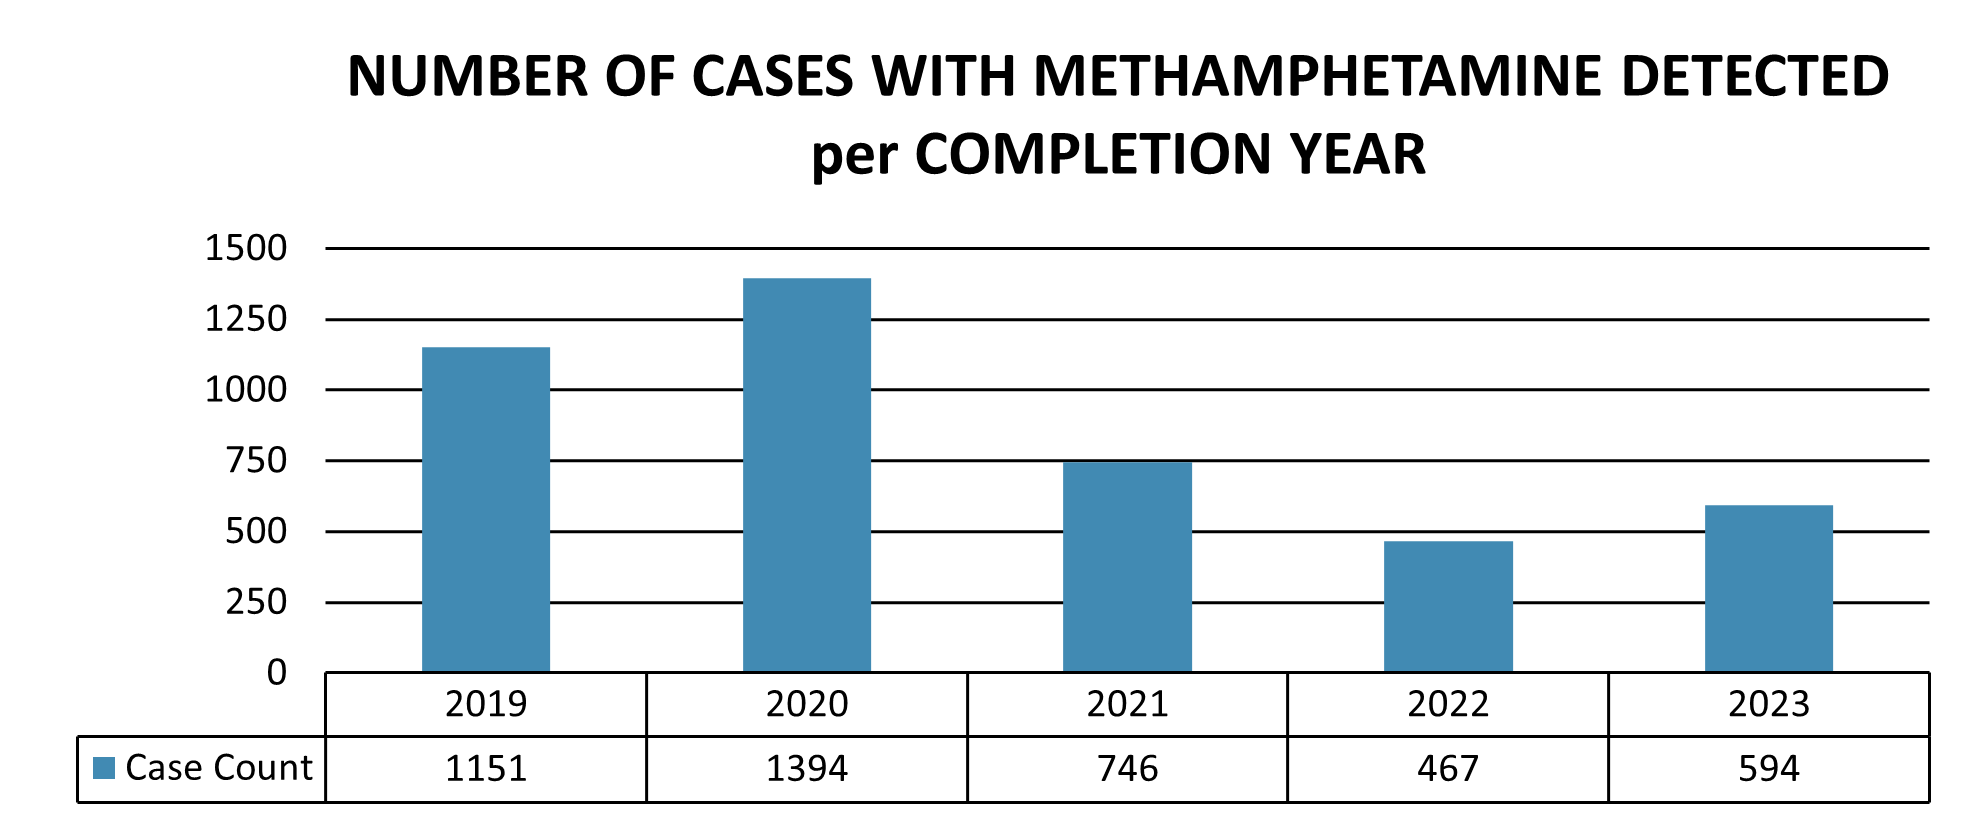
As illustrated in Figure 18 the number of cases completed that had methamphetamine detected has decreased from 1151 in 2019 to 594 in 2023, which equates to an approximate 48.3% decrease. Additionally, for the 946 examined cases completed in 2023 approximately 62.7% of them had at least 1 methamphetamine positive exhibit.
| 2019 | 2020 | 2021 | 2022 | 2023 | |
|---|---|---|---|---|---|
| Case Count | 1151 | 1394 | 746 | 467 | 594 |
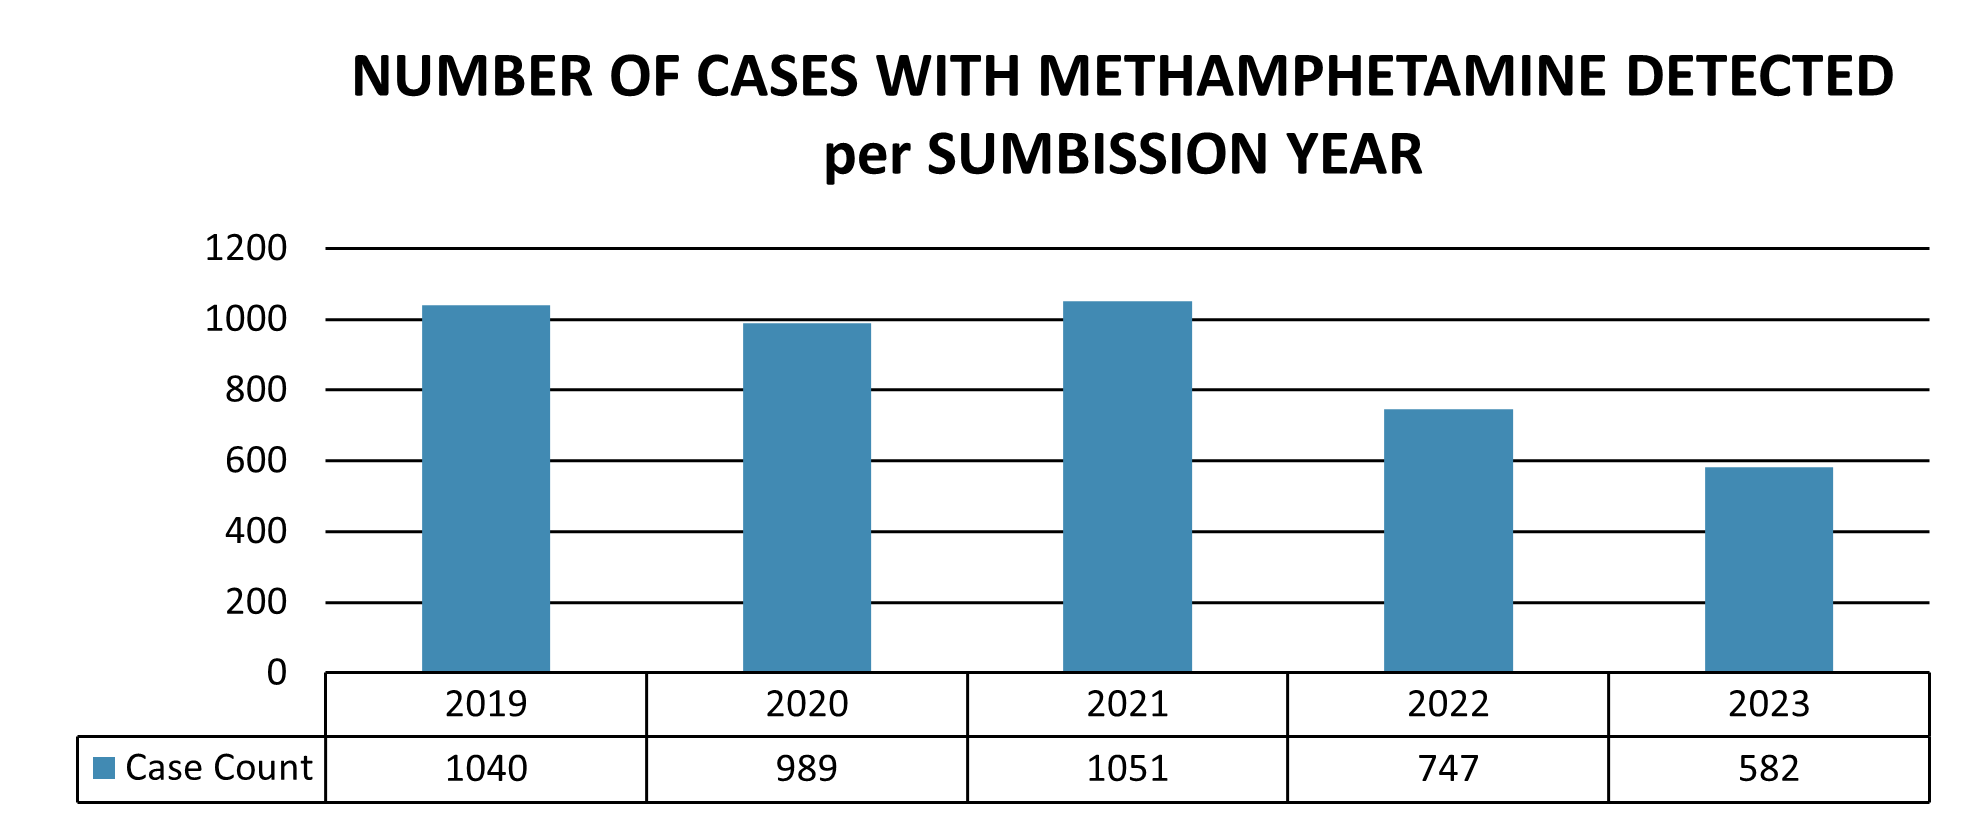
As illustrated in Figure 19 the number of cases completed that had methamphetamine detected has generally decreased over the 5-year period. Additionally, for the 1118 cases submitted in 2023 approximately 52.0% had at least 1 methamphetamine positive exhibit.
| 2019 | 2020 | 2021 | 2022 | 2023 | |
|---|---|---|---|---|---|
| Case Count | 1040 | 989 | 1051 | 747 | 582 |
Cocaine
Cocaine is an addictive stimulant drug obtained from the leaves of two different coca plant species. It is submitted to the laboratory in the form of a white powder, or it can be in the form that looks like a small irregularly shaped rock (cocaine base). It may also be found mixed with other illicit drugs. It speeds up the body making the user feel full of energy, happy, and excited; however, the person’s mood might change, and they can become angry, nervous, and afraid. The long-term adverse effects include heart attacks or strokes.
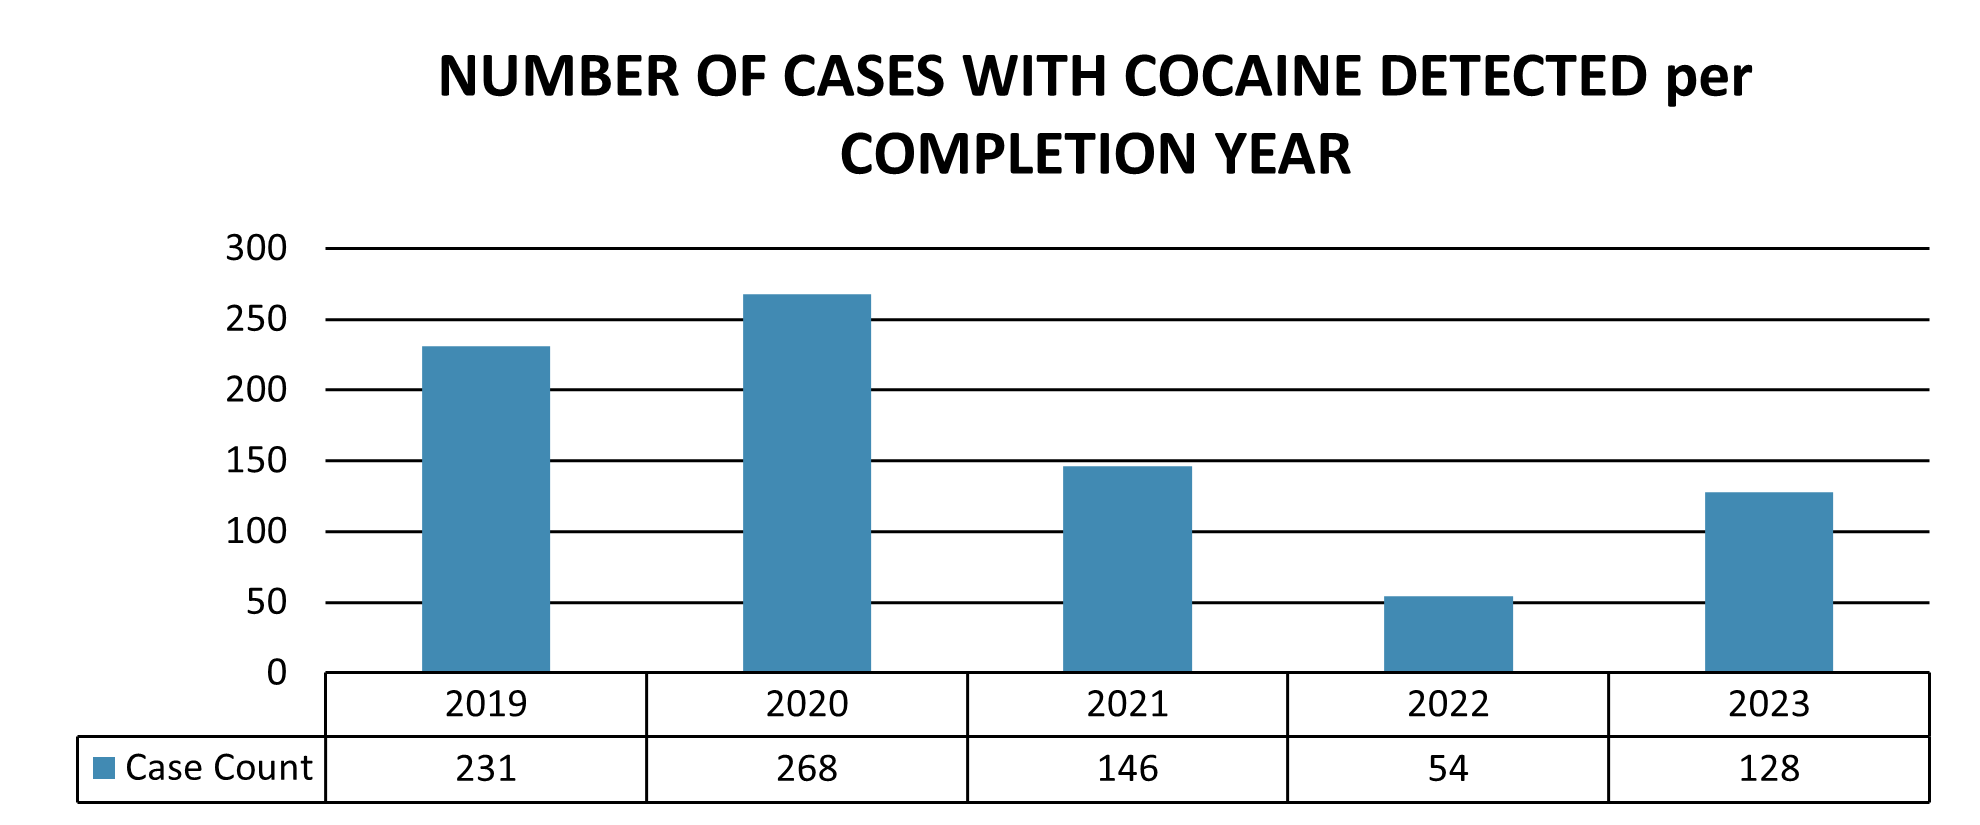
As illustrated in Figure 20 the number of cases completed that had cocaine detected has decreased from 231 in 2019 to 128 in 2023, which equates to an approximate 44.5% decrease. Additionally, for the 952 cases completed in 2023 approximately 13.4% of them had at least 1 positive cocaine exhibit.
| 2019 | 2020 | 2021 | 2022 | 2023 | |
|---|---|---|---|---|---|
| Case Count | 231 | 268 | 146 | 54 | 128 |
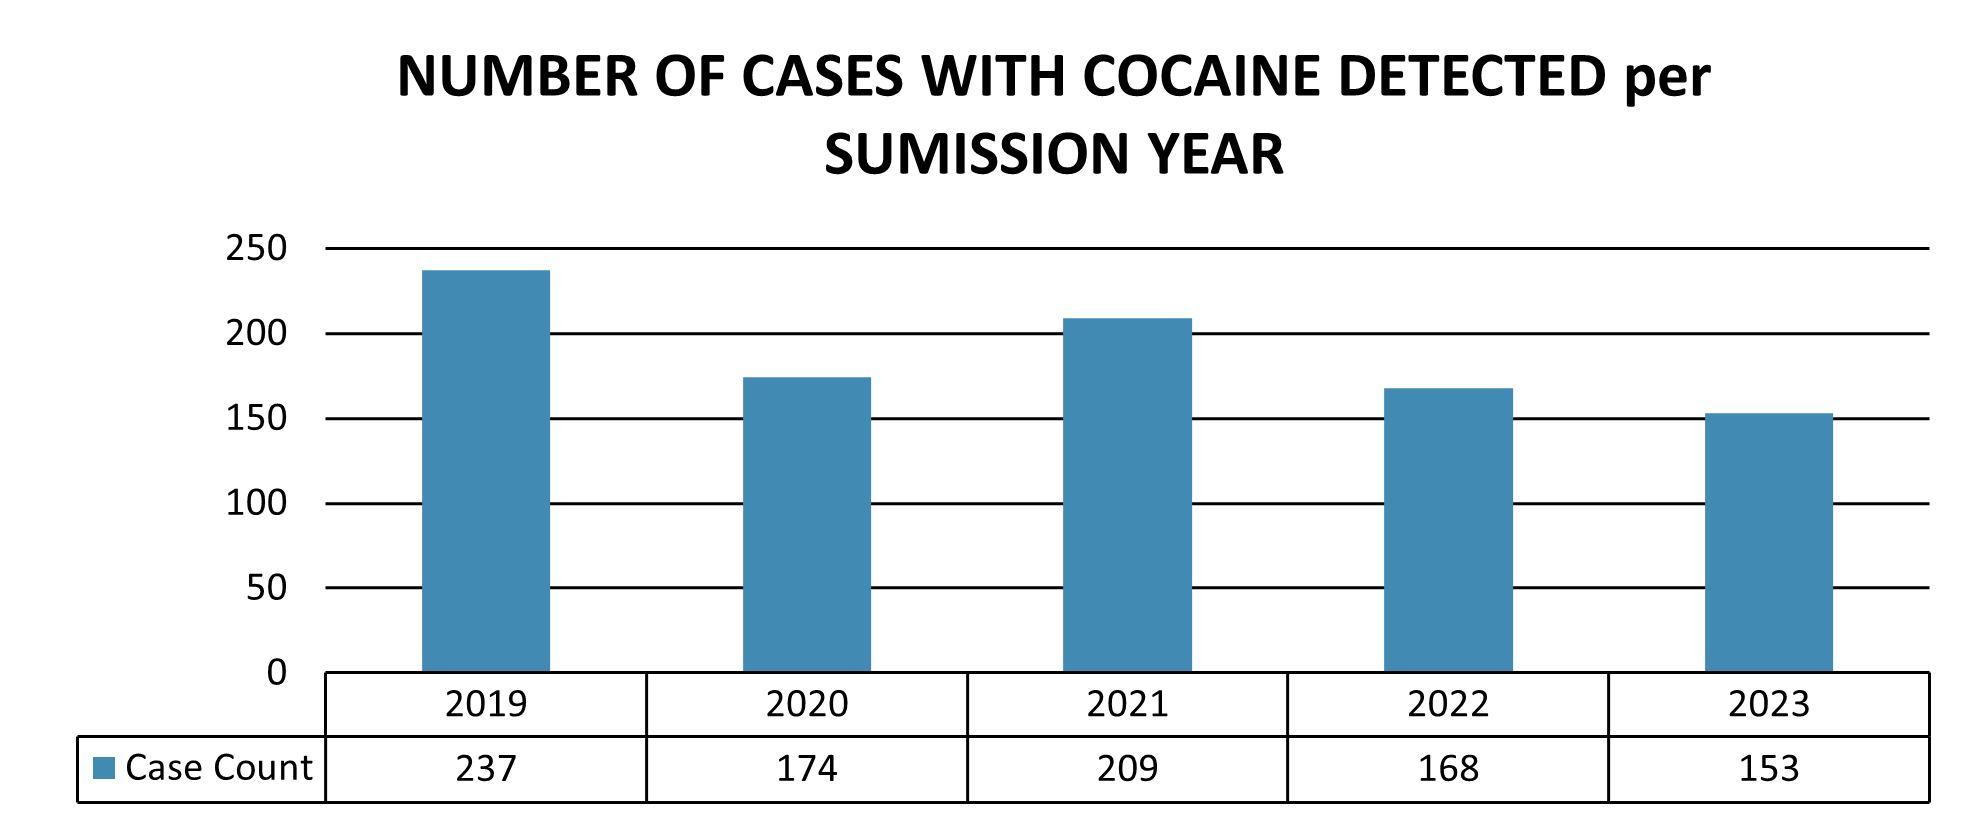
As illustrated in Figure 21 the number of cases submitted that had cocaine detected has decreased from 237 in 2019 to 153 in 2023, which equates to an approximate 35.4% decrease. Additionally, for the 1118 cases submitted in 2023 approximately 13.6% of them had at least 1 positive cocaine exhibit.
| 2019 | 2020 | 2021 | 2022 | 2023 | |
|---|---|---|---|---|---|
| Case Count | 237 | 174 | 209 | 168 | 153 |
Tetrahydrocannabinol
Tetrahydrocannabinol (THC) is a psychoactive substance found in the cannabis sativa plant, of which marijuana and hemp are two varieties. Tetrahydrocannabinol can be detected when analyzing a marijuana plant, in oil form, or mixed with other drugs of abuse. THC can be confirmed by the laboratory even when marijuana is not able to be confirmed via microscopy.
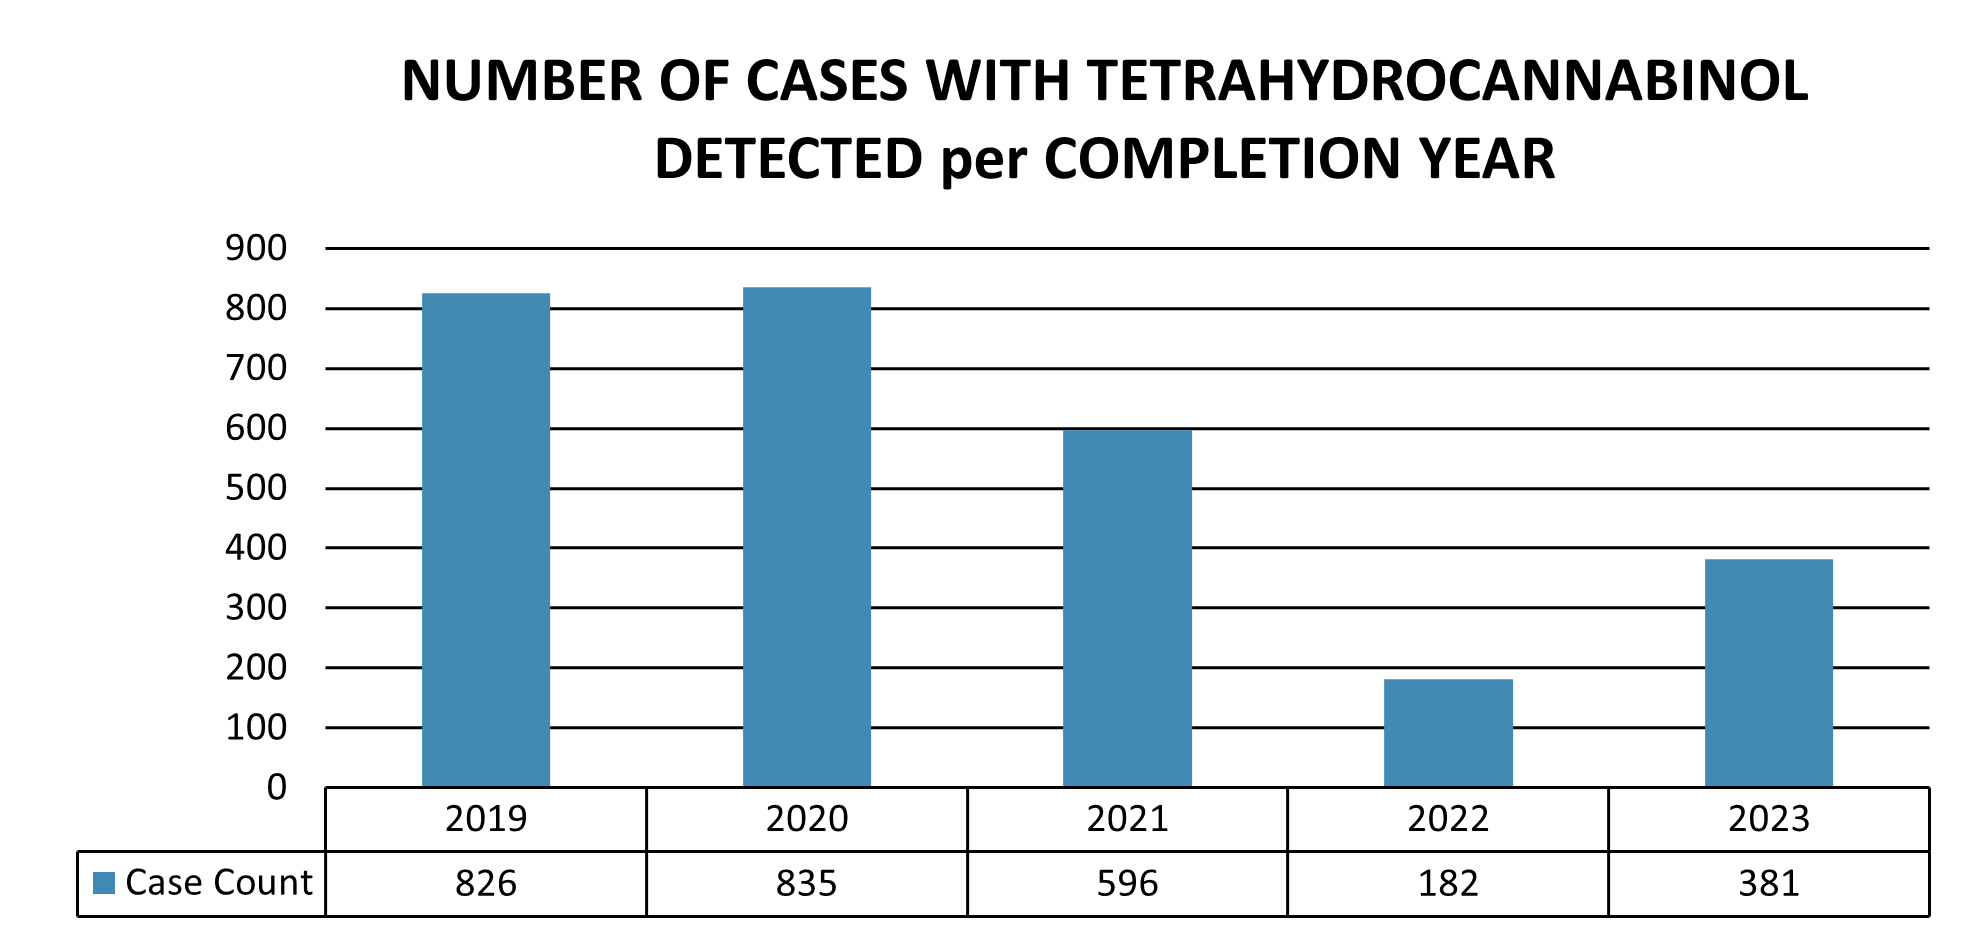
As illustrated in Figure 22 the number of cases completed that had THC detected has decreased from 826 in 2019 to 381 in 2023, which equates to an approximate 53.8% decrease. Additionally, of the 952 cases completed in 2023 approximately 40.0% of them resulted in at least 1 tetrahydrocannabinol positive exhibit.
| 2019 | 2020 | 2021 | 2022 | 2023 | |
|---|---|---|---|---|---|
| Case Count | 826 | 835 | 596 | 182 | 381 |
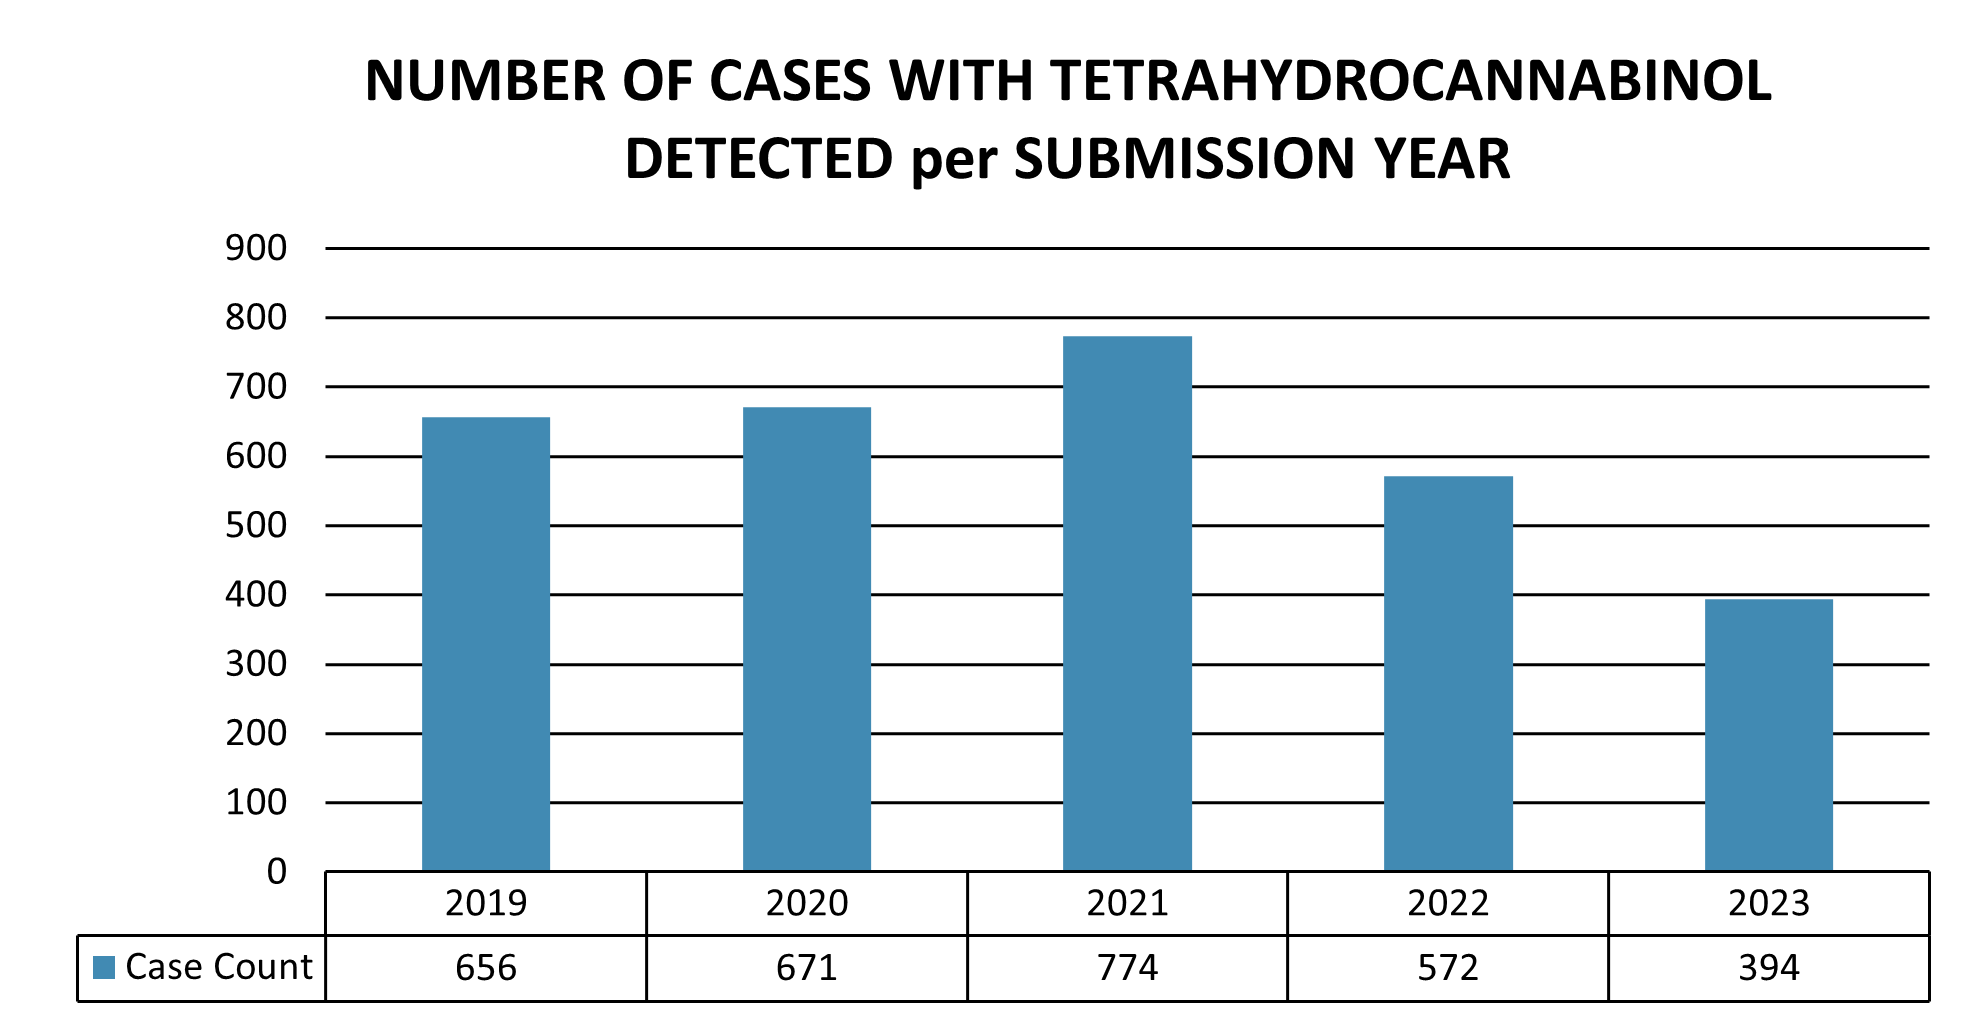
As illustrated in Figure 23 the number of cases submitted that had THC detected has decreased from 656 in 2019 to 394 in 2023, which equates to an approximate 39.9% decrease since 2019. Additionally, of the 1118 cases submitted in 2023 approximately 35.2% of them at least 1 tetrahydrocannabinol positive exhibit.
| 2019 | 2020 | 2021 | 2022 | 2023 | |
|---|---|---|---|---|---|
| Case Count | 656 | 671 | 774 | 572 | 394 |
Clonazolam
Clonazolam is the most potent of a series of 1-4 triazolobenzodiazepines that may cause severe sedation. Clonazolam is a triazolo-analogue of the registered drug clonazepam. Clonazolam is sold in powdered form as well as in blotter, liquid, and tablet form. In recent years clonazolam has been increasingly sold as falsified designer benzodiazepines (commonly as diazepam and alprazolam).
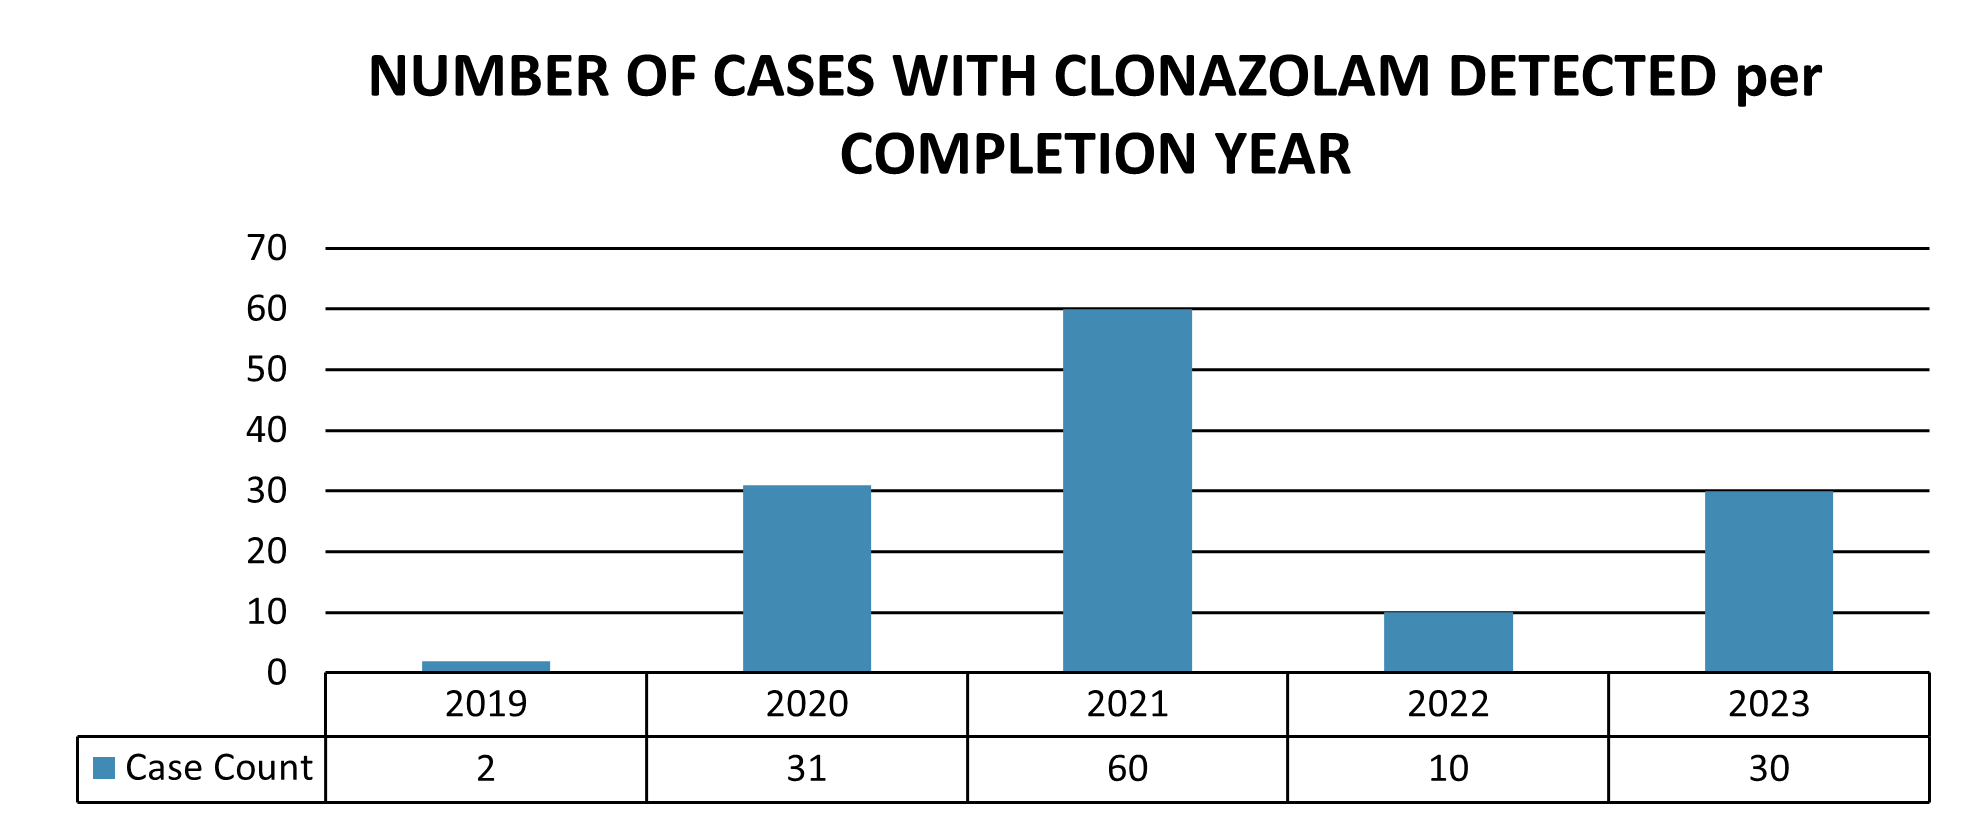
As illustrated in Figure 24 the number of cases completed that had clonazolam detected has increased from 2 in 2019 to 30 in 2023. Additionally, for the 952 cases completed in 2023 approximately 3.1% of them had at least 1 clonazolam positive exhibit.
| 2019 | 2020 | 2021 | 2022 | 2023 | |
|---|---|---|---|---|---|
| Case Count | 2 | 31 | 60 | 10 | 30 |
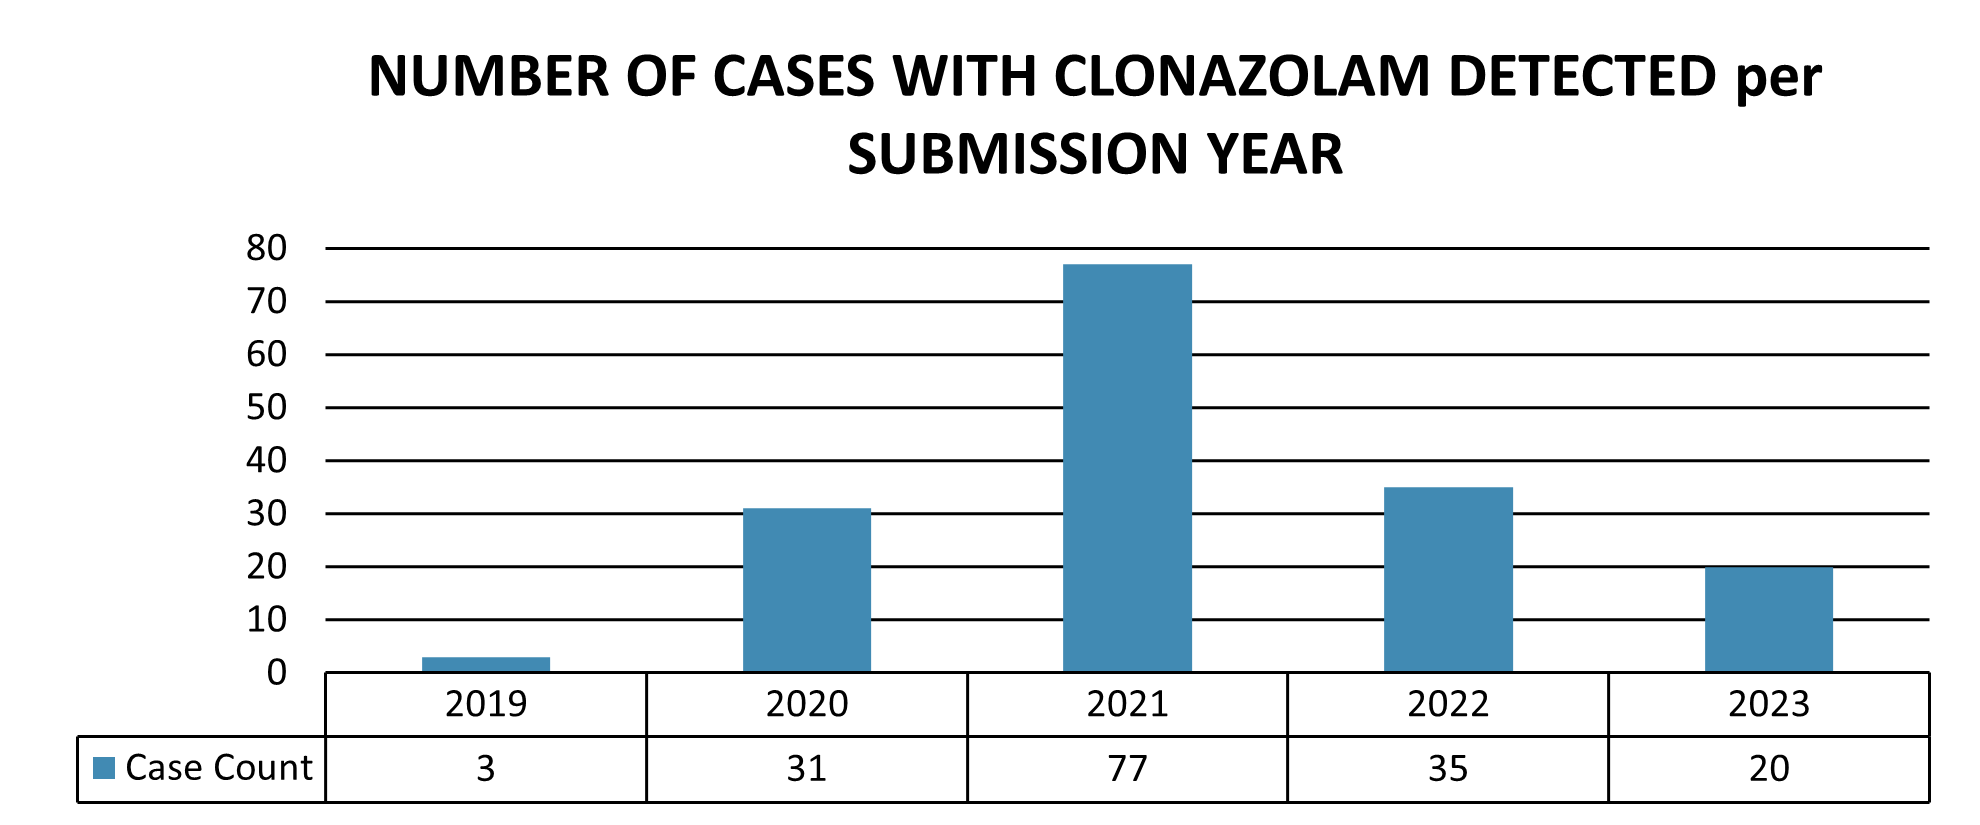
As illustrated in Figure 25 the number of cases submitted in 2023 that had clonazolam detected has increased from 3 in 2019 to 20 in 2023, which equates to an approximate 566.7% increase. However, it is an approximate 74.1% decrease from 2021. Additionally, for the 1118 cases submitted in 2023 approximately 1.7% of them had at least 1 clonazolam positive exhibit.
| 2019 | 2020 | 2021 | 2022 | 2023 | |
|---|---|---|---|---|---|
| Case Count | 3 | 31 | 77 | 35 | 20 |
Eutylone
Eutylone is a substituted cathinone which is a category of drugs related to cathinone, which is found naturally occurring in the khat plant. Eutylone is an empathogen, which increases an individual’s feeling of empathy and benevolence and increases the feeling of being socially accepted by and connected with others. The effects are similar to other stimulant and empathogenic drugs such as MDMA, cocaine and amphetamines.
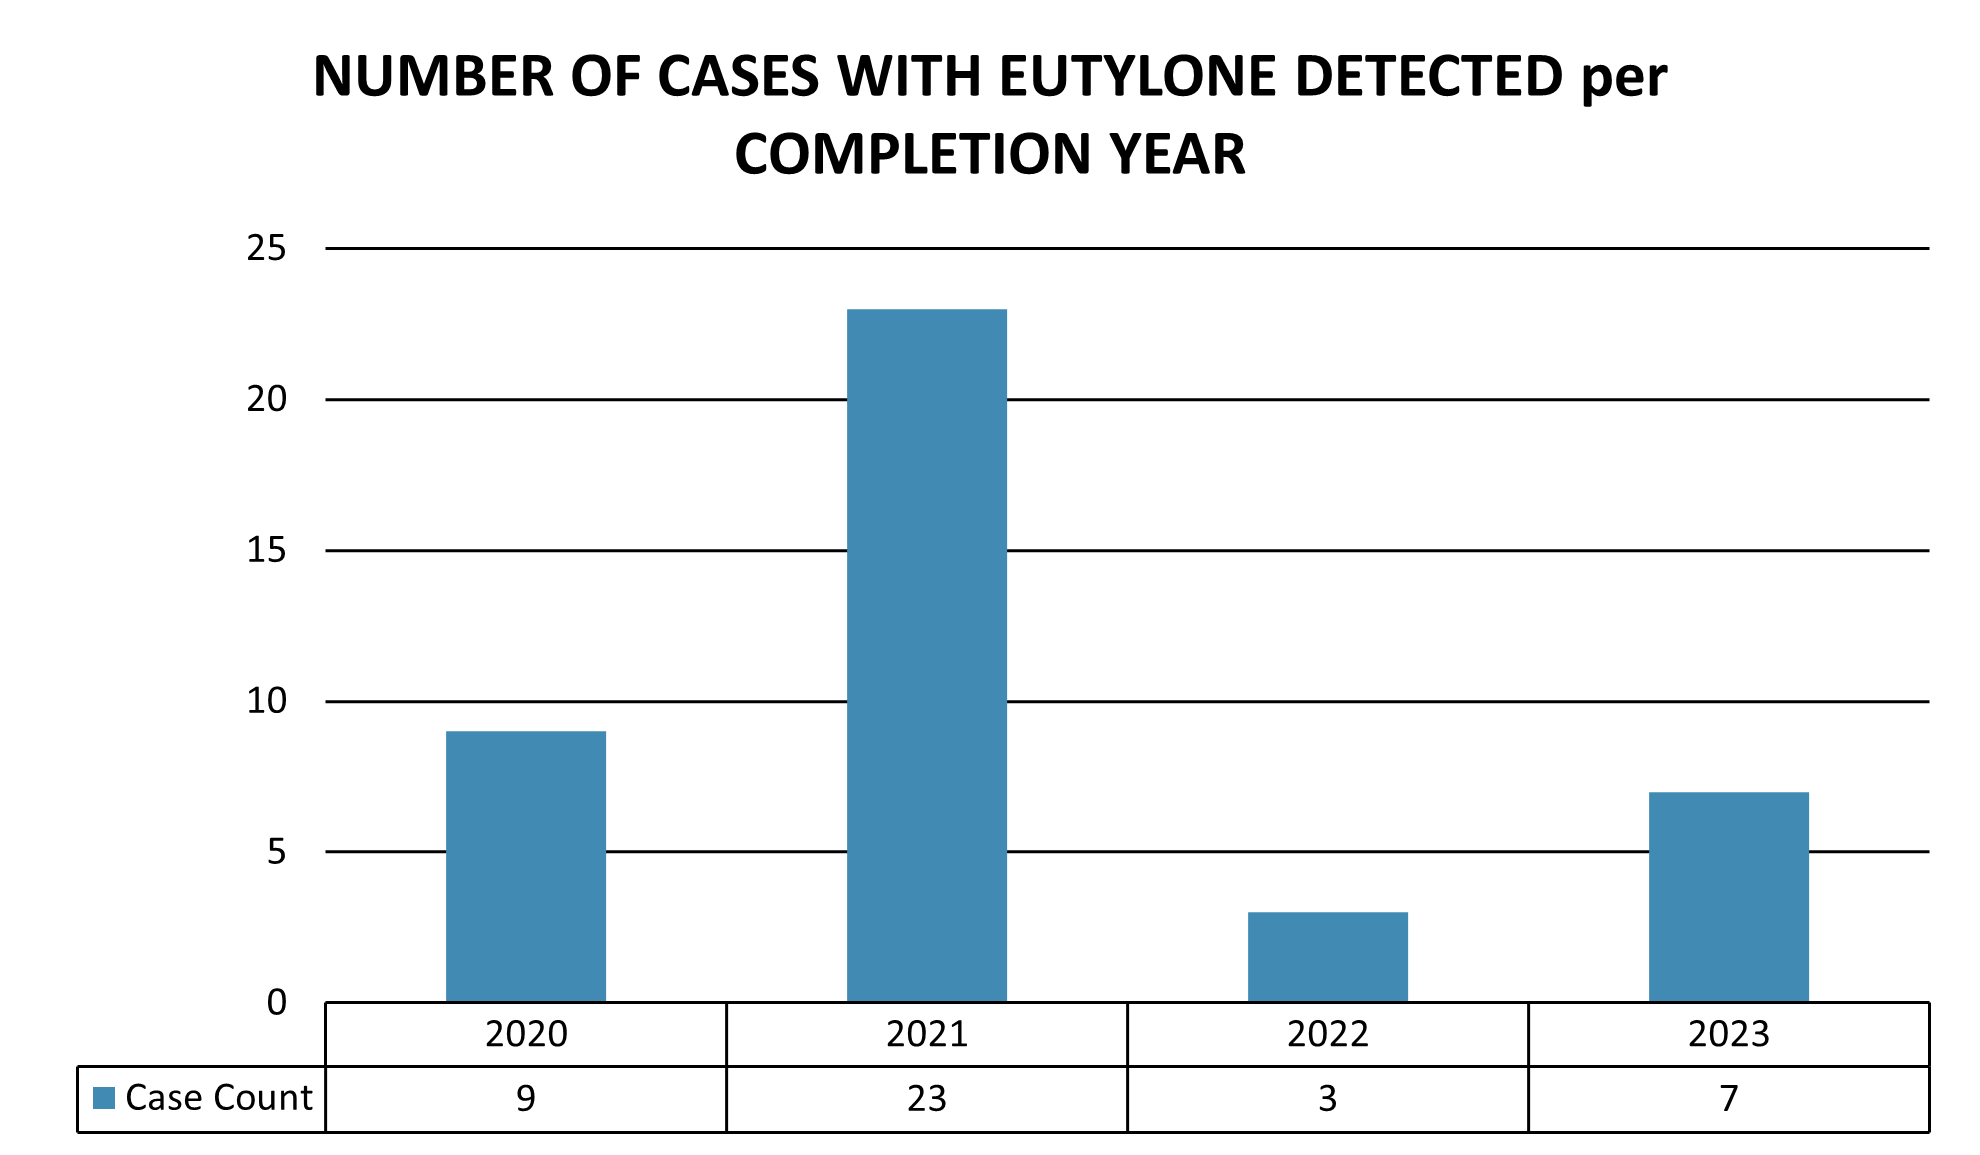
As illustrated in Figure 26 the number of cases completed that had eutylone detected has decreased from 9 in 2020 to 7 in 2023, which equates to a 22.2% decrease. Additionally, for the 952 cases completed in 2023 approximately 0.7% of them had at least 1 eutylone positive exhibit.
| 2020 | 2021 | 2022 | 2023 | |
|---|---|---|---|---|
| Case Count | 9 | 23 | 3 | 7 |
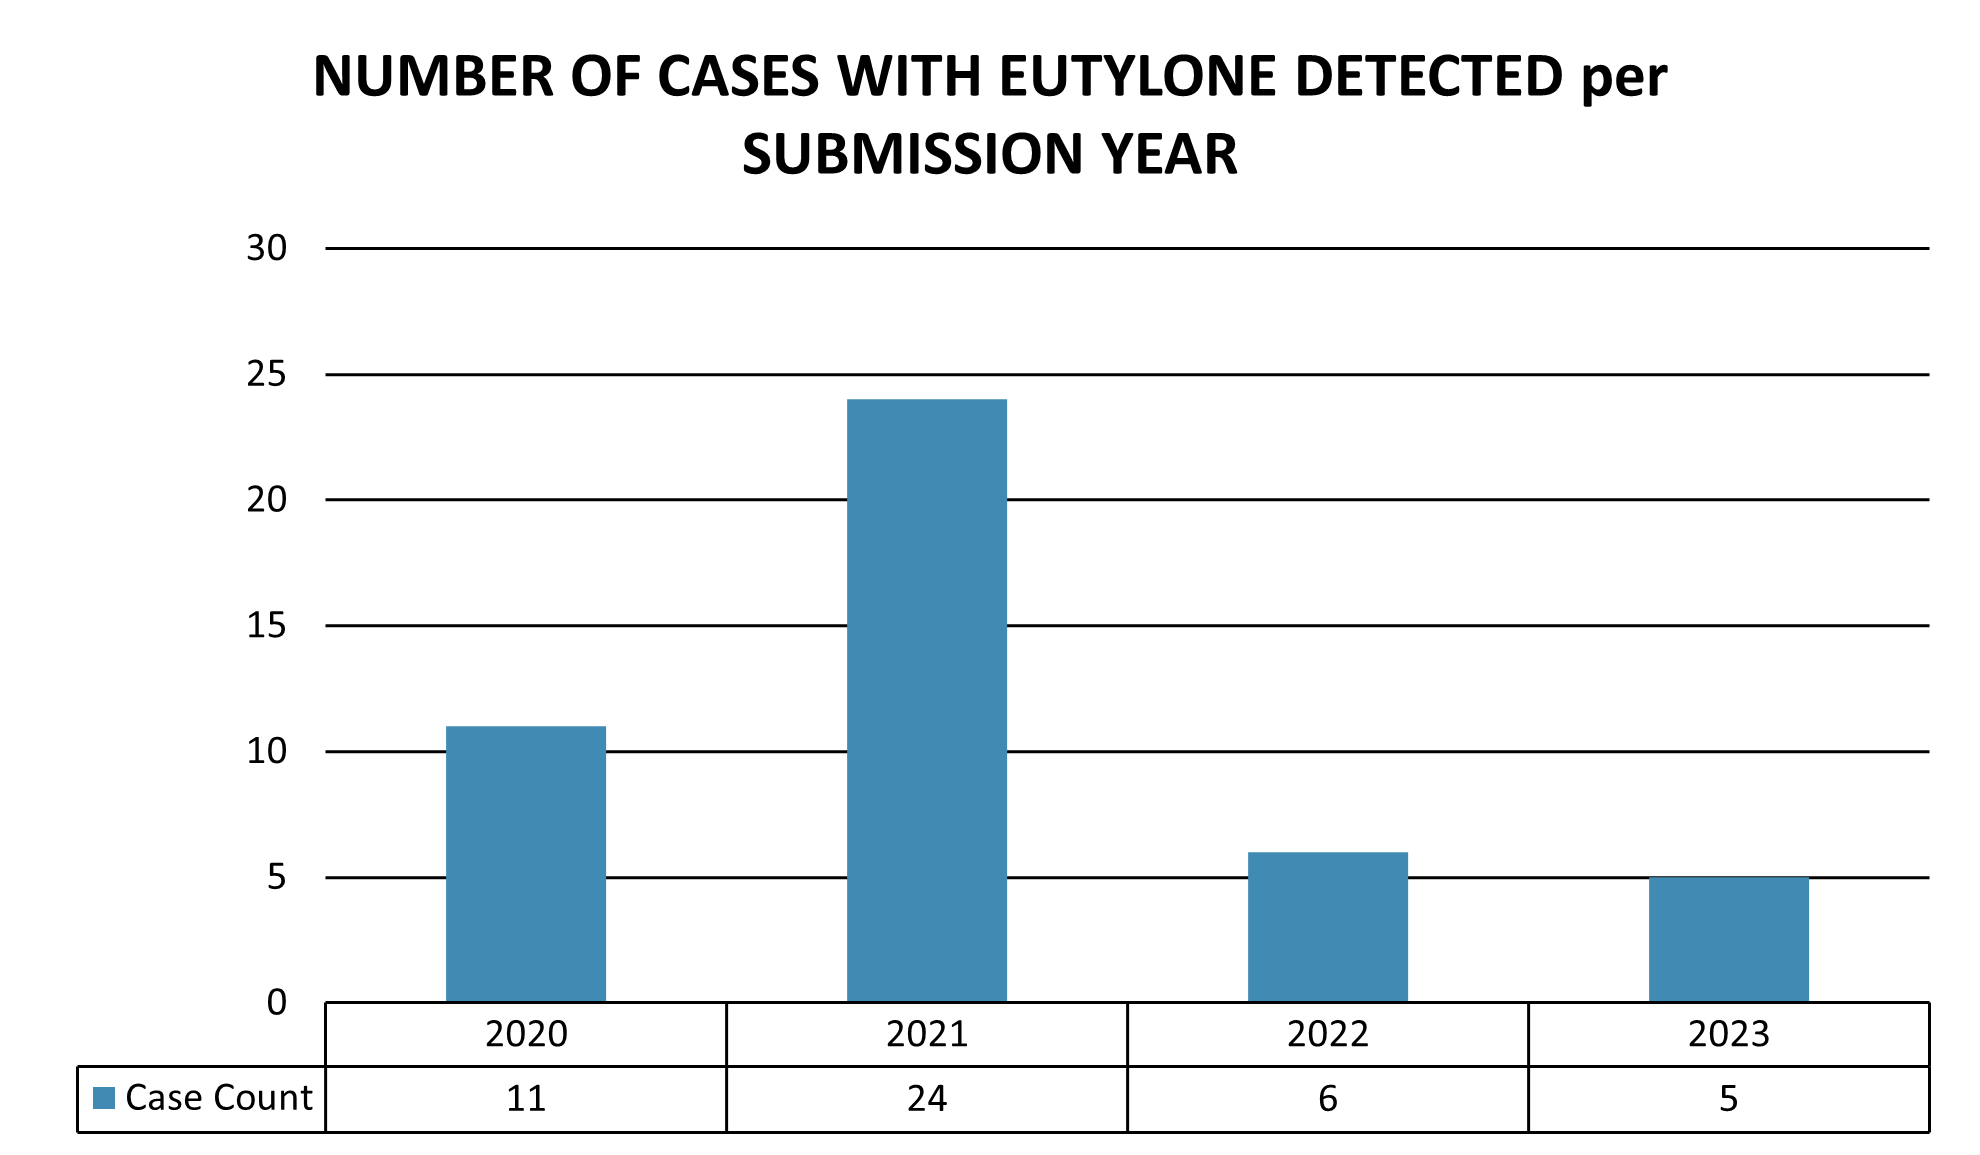
As illustrated in Figure 27 the number of cases completed that had eutylone detected has decreased from 11 in 2020 to 5 in 2023, which equates to a 54.5% decrease. Additionally, for the 1118 cases submitted in 2023 approximately 0.4% of them had at least 1 eutylone positive exhibit.
| 2020 | 2021 | 2022 | 2023 | |
|---|---|---|---|---|
| Case Count |
Fire Debris
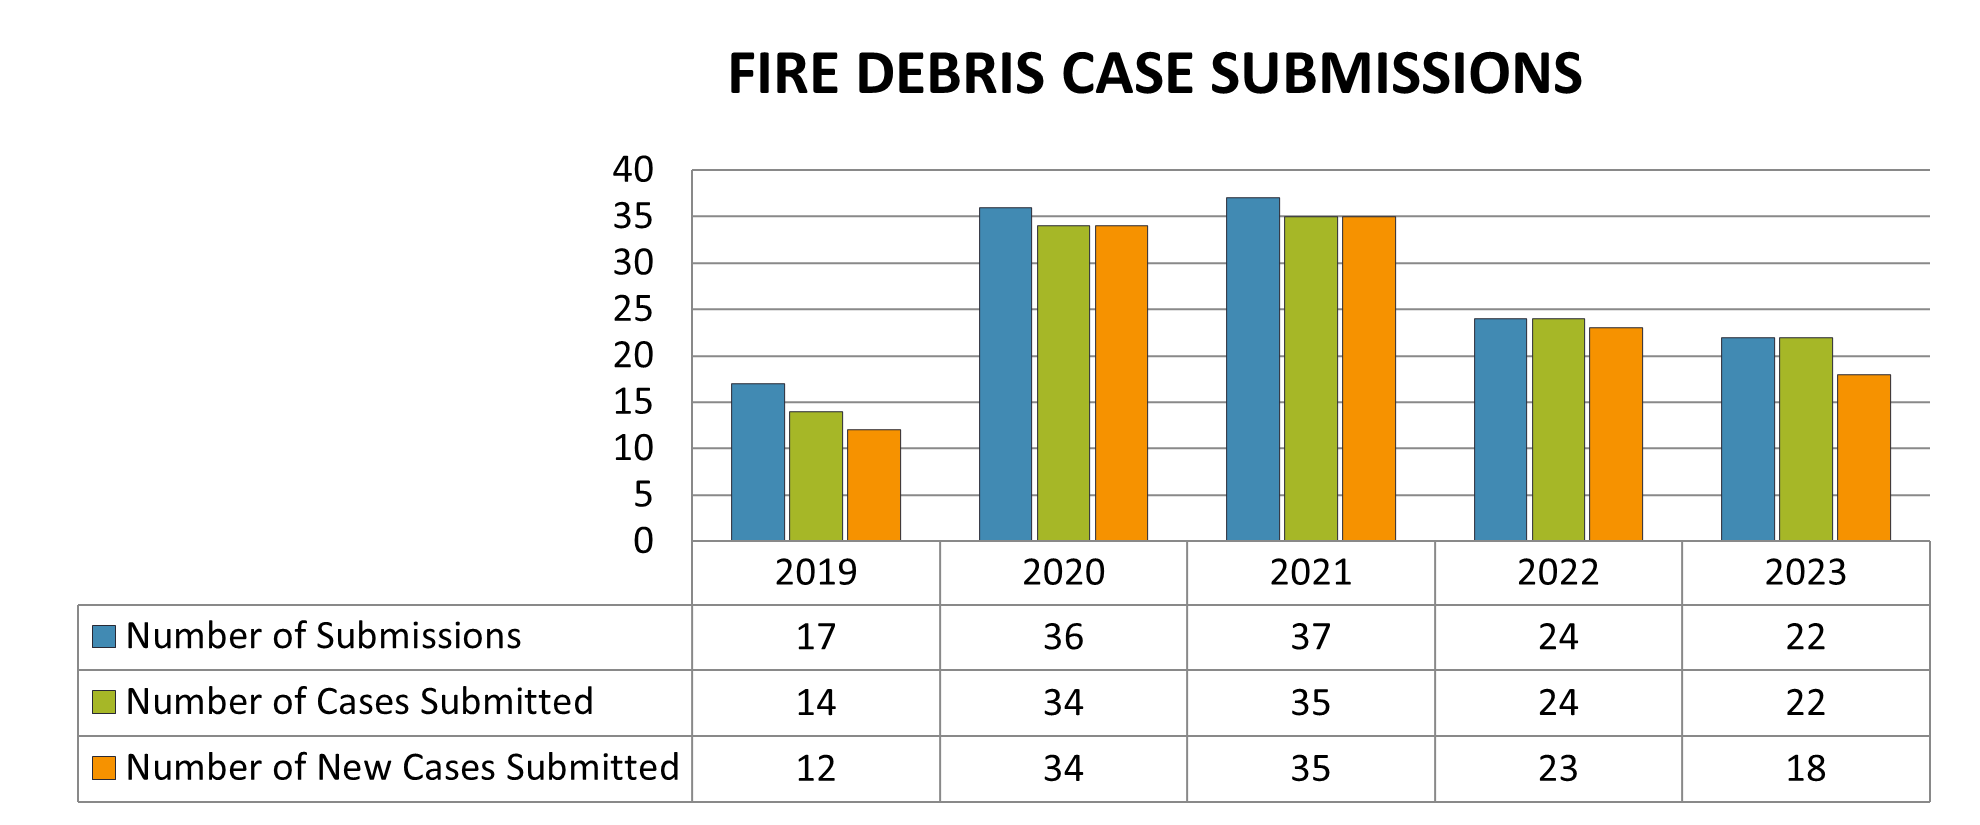
The Fire Debris Laboratory examines fire debris evidence in support of fire investigations. The information provided to the investigator aides in determining if a fire was accidentally or intentionally set for purposes ranging from insurance fraud to homicide.
In 2023, the Fire Debris Laboratory received evidence from 18 cases with a total of 18 submissions. The trend of case submissions over the last five years is illustrated in Figure 28.
| 2019 | 2020 | 2021 | 2022 | 2023 | |
|---|---|---|---|---|---|
| Number of Submissions | 17 | 36 | 37 | 24 | 22 |
| Number of Cases Submitted | 14 | 34 | 35 | 24 | 22 |
| Number of New Cases Submitted | 12 | 34 | 35 | 23 | 18 |
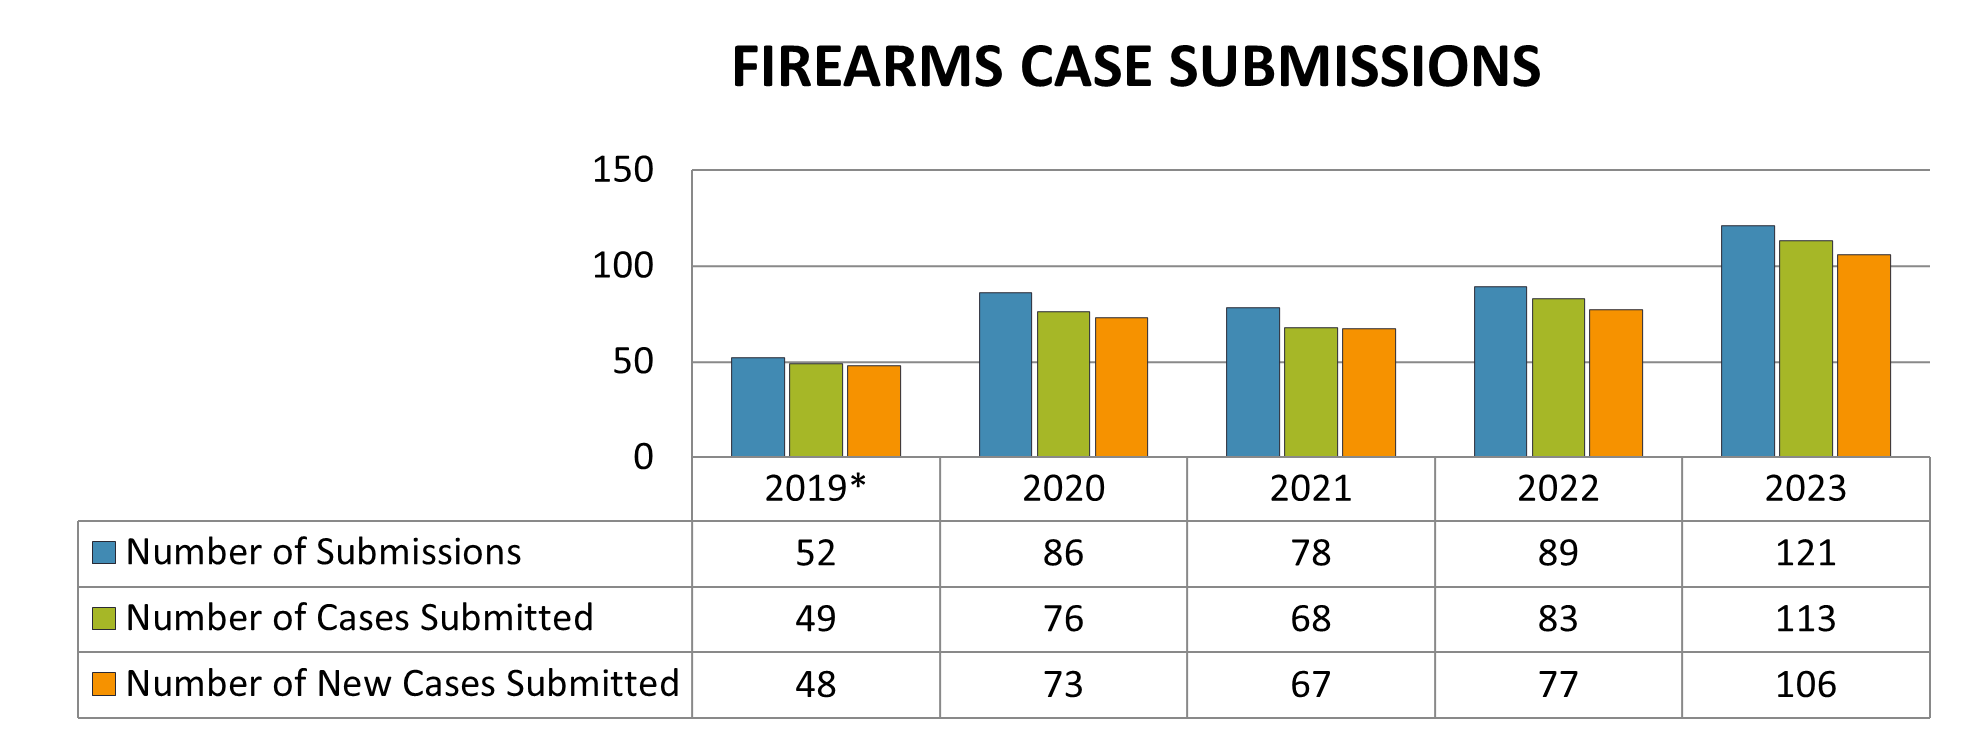
Firearms
Firearm examination is conducted in support of state and federal law enforcement. The Firearms Laboratory conducts many types of forensic examinations. The majority of examinations involve operability (function) tests on the submitted firearms. Other exams performed by the Firearms Laboratory include bullet comparisons, cartridge case comparisons, and serial number restorations. In 2023, the Firearms Laboratory received evidence from 110 cases with a total of 117 submissions. The trend of case submissions over the last five years is illustrated in Figure 29.
| 2019* | 2020 | 2021 | 2022 | 2023 | |
|---|---|---|---|---|---|
| Number of Submissions | 52 | 86 | 78 | 89 | 121 |
| Number of Cases Submitted | 49 | 76 | 68 | 83 | 113 |
| Number of New Cases Submitted | 48 | 73 | 67 | 77 | 106 |
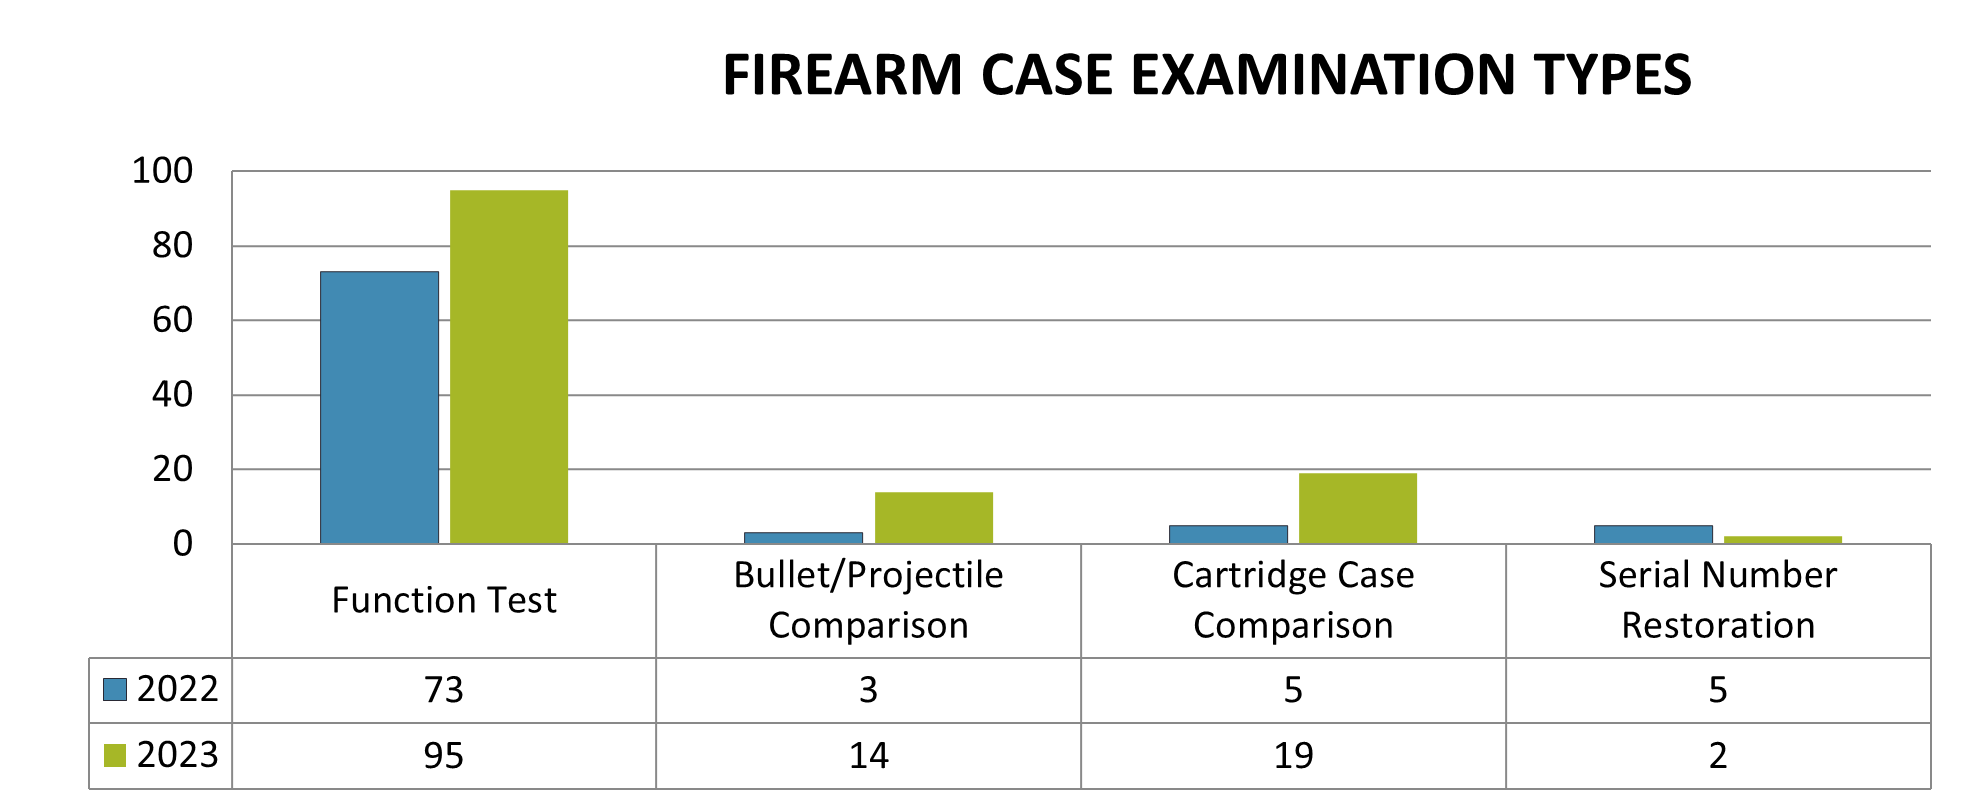
Case examination types (function test, bullet/projectile comparison, cartridge case comparison, serial number restoration) that were requested in 2023 are illustrated in Figure 30. Illustrated in Figure 31 are the number of requested items that were examined per case examination type. As a component of examinations the laboratory performed test fires on 91 cases that were requested for examination in 2023.
| Function Test | Bullet/Projectile Comparison | Cartridge Case Comparison | Serial Number Restoration | |
| 2022 | 73 | 3 | 5 | 5 |
| 2023 | 95 | 14 | 19 | 2 |
Biology/DNA
The Biology/DNA Laboratory examines evidence from a variety of cases including sex crimes (rape, indecent liberties, incest, etc.), homicides, property crimes, assaults, and forensic identifications (unidentified bodies).
The laboratory screens evidence for the presence of biological material (blood, semen, and saliva). For DNA analysis, the laboratory generates short tandem repeat (STR) profiles from the scene exhibits, those profiles can then be compared to reference standards collected from individuals believed to be associated with the scene (victims, suspects, or other known individuals). Ultimately results are interpreted, and a conclusion is obtained as to whether the reference standard profiles are consistent with or excluded from the crime scene profiles. The nature of forensic samples collected at crime scenes vary greatly. Under optimal circumstances (fresh blood stains), high quality single source profiles may result. Alternatively, the samples may have been left by multiple individuals or exposed to environmental elements, which can lead to low quantity/degraded samples. All these factors affect the laboratory’s ability to obtain a comparable profile. If a profile is suitable for comparison, statistical analysis may be performed by analysts so that power of discrimination can be clearly presented to a jury when an association is made between a reference sample and a scene exhibit.
In 2023, the Biology/DNA Laboratory received evidence from 232 cases with a total of 329 submissions. The trends of case submissions over the past five years are illustrated in Figure 32.
| 2019 | 2020 | 2021 | 2022 | 2023 | |
|---|---|---|---|---|---|
| Number of Submissions | 451 | 450 | 459 | 338 | 343 |
| Number of Cases Submitted | 333 | 309 | 302 | 240 | 260 |
| Number of New Cases Submitted | 253 | 263 | 227 | 188 | 220 |
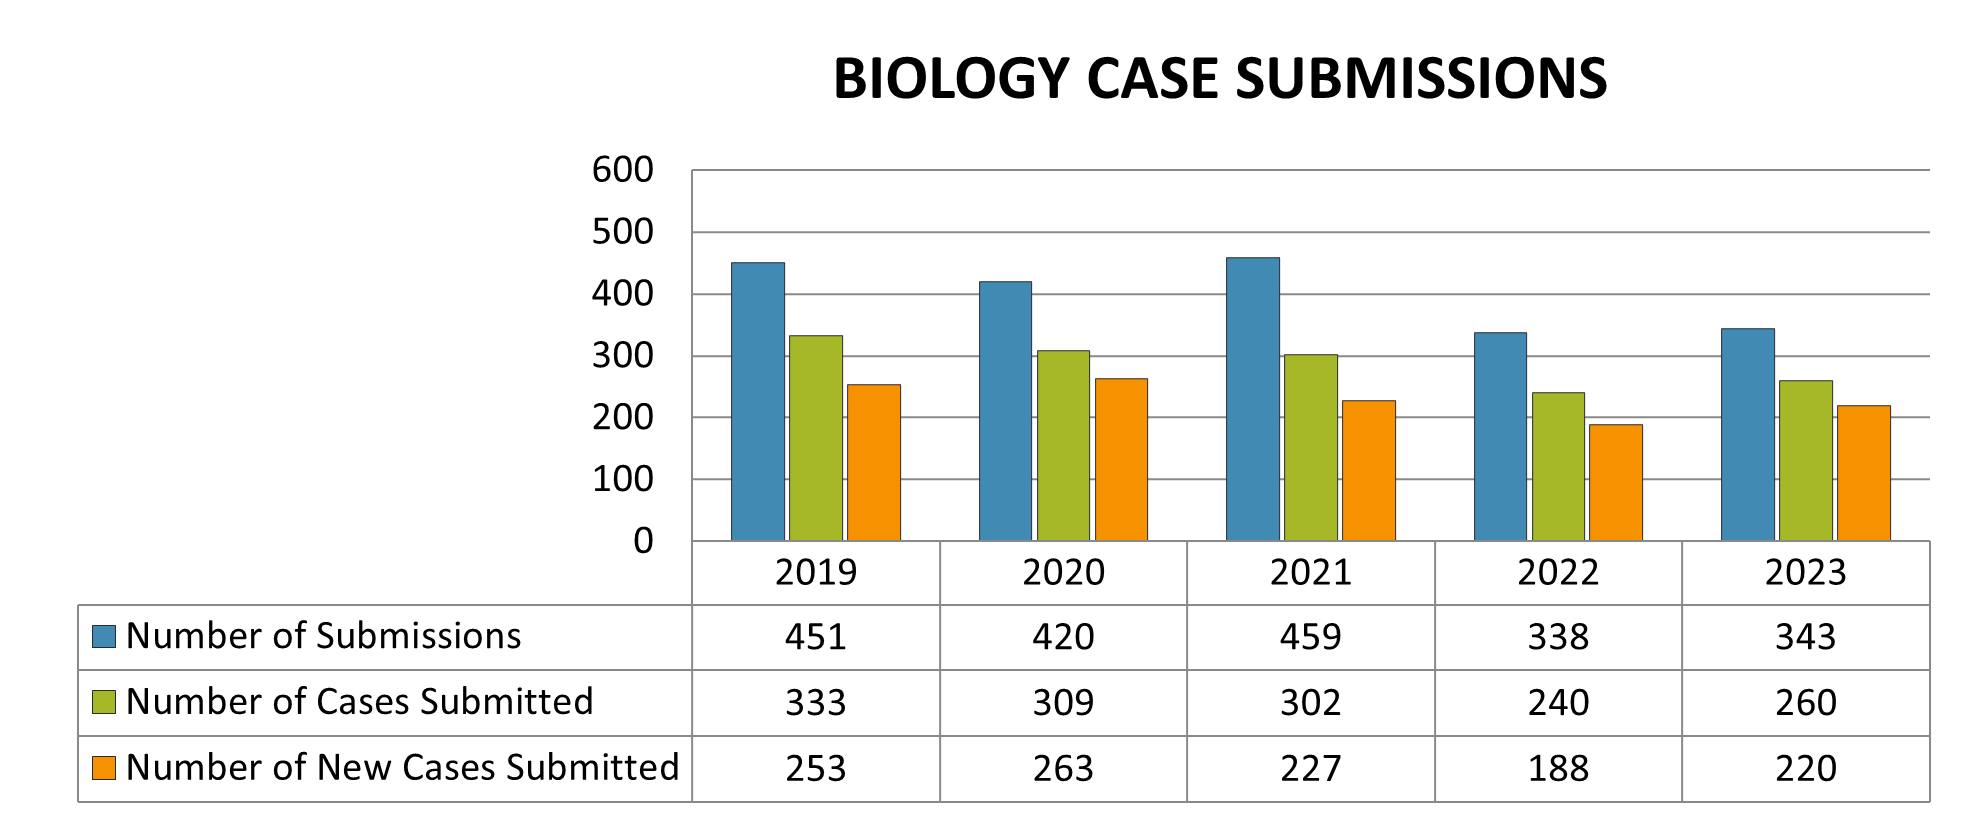
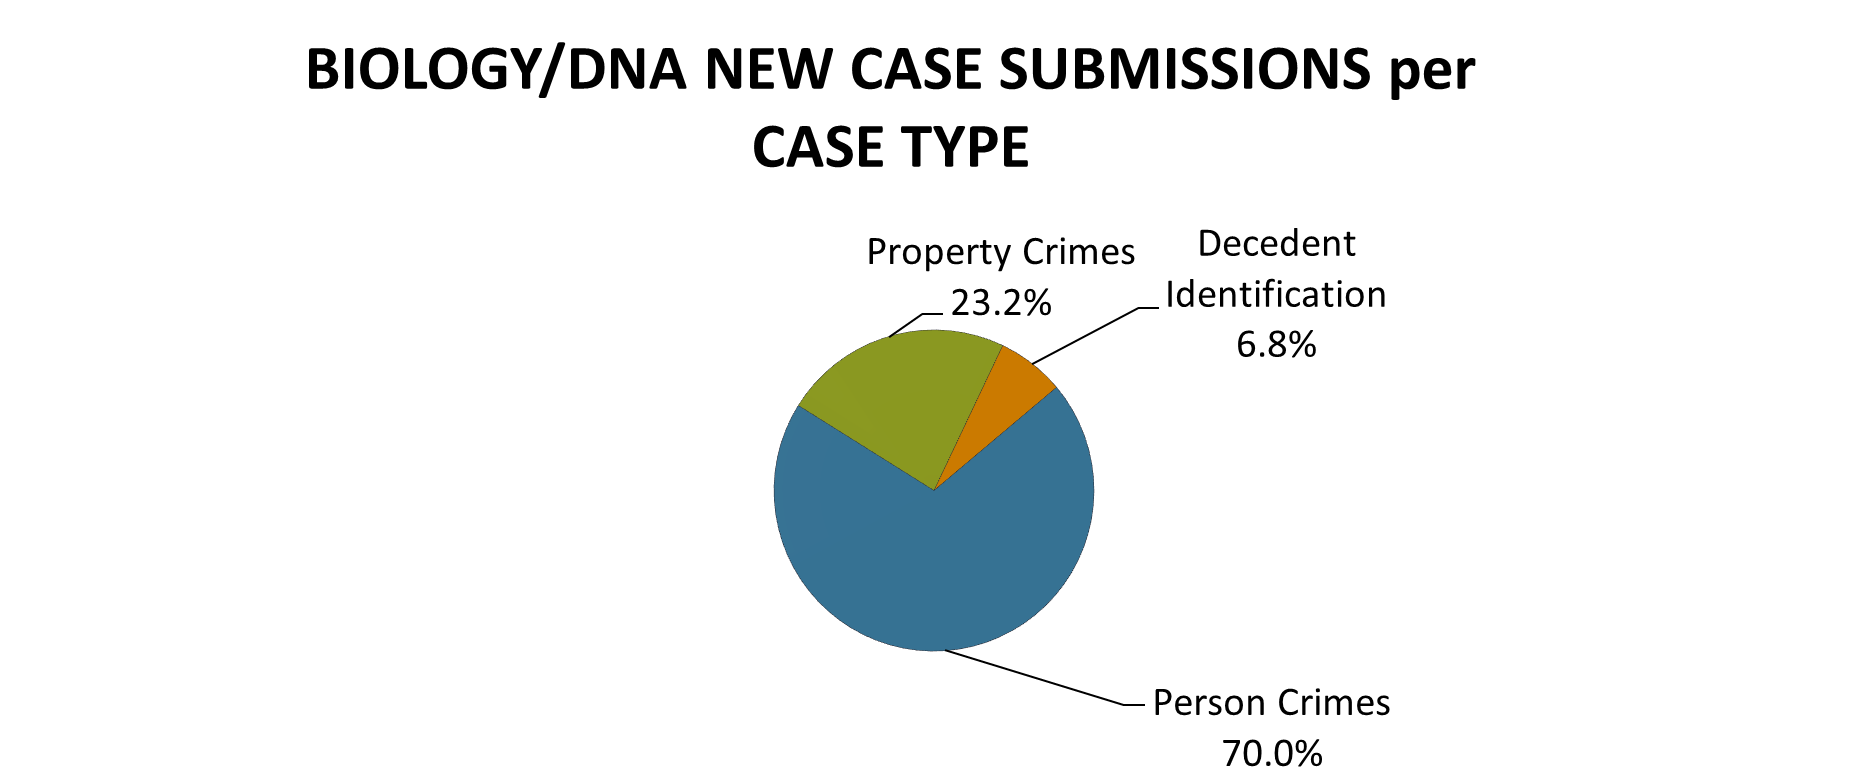
Figure 33 illustrates the percentage of case type categories submitted for biological testing. For crimes against persons, sex crime cases were the most common case type submitted for examination. Property crimes continue to have a high likelihood of resulting in a profile suitable for CODIS entry. Given that these crimes have a high recidivism rate they have an exceptional solvability factor when crime scene profiles are searched against the database. In support of the District Coroner, the laboratory identified 22 human remains through DNA analysis.
| Person Crimes | Property Crimes | Decedent Identification | |
|---|---|---|---|
| Percentage of Submissions | 70.0 | 23.2 | 6.8 |
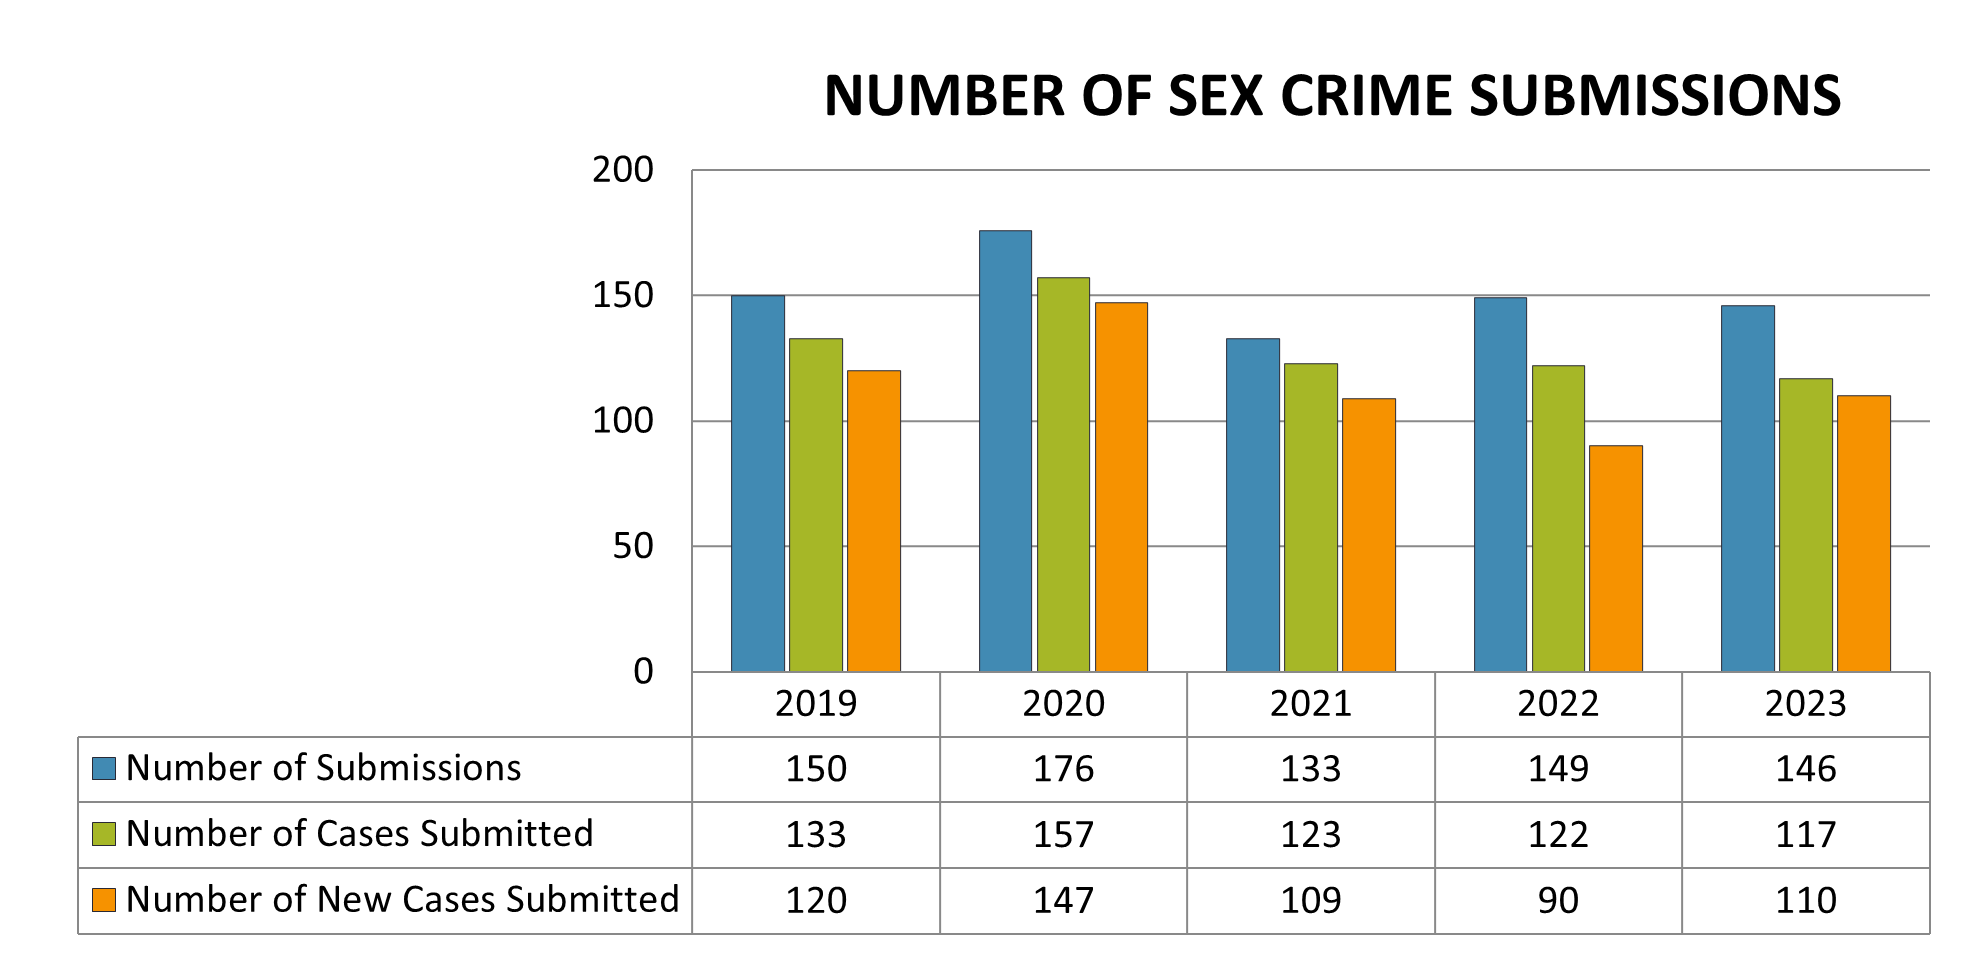
The number of sex crime cases submitted to the Biology/DNA Laboratory over the last five years is illustrated in Figure 34. In 2023, the Biology/DNA Laboratory received evidence from 118 sex crime cases with a total of 146 submissions.
| 2019 | 2020 | 2021 | 2022 | 2023 | |
|---|---|---|---|---|---|
| Number of Submissions | 150 | 176 | 133 | 149 | 146 |
| Number of Cases Submitted | 133 | 157 | 123 | 122 | 117 |
| Number of New Cases Submitted | 120 | 147 | 109 | 90 | 110 |
CODIS
The Combined DNA Index System (CODIS) is database software used to compare DNA profiles within and between crime laboratories throughout the nation. In 2007 Kansas became an all arrestee state, meaning that law enforcement collects DNA samples for any person arrested for qualifying offenses. DNA profiles generated from an arrestee/offender are entered into the state database in Topeka, KS and is available to be searched against the unknown profiles the Sedgwick County laboratory enters into the local database. In late 2009, the DNA Laboratory adopted new procedures for the release of investigative lead information to include formal written and reviewed notifications for database associations.
Over the years, the increased number of associations identified through CODIS resulted in an increase in reports generated, as well as an increase in the number of known samples processed to confirm these additional CODIS hits. The number of CODIS entries, associated hits generated, and oversight of this database, entails a large amount of scientist time. Samples compared as a function of database management are not reflected in the number of cases submitted or accounted for as a separate “case type” in the figures describing case submissions.
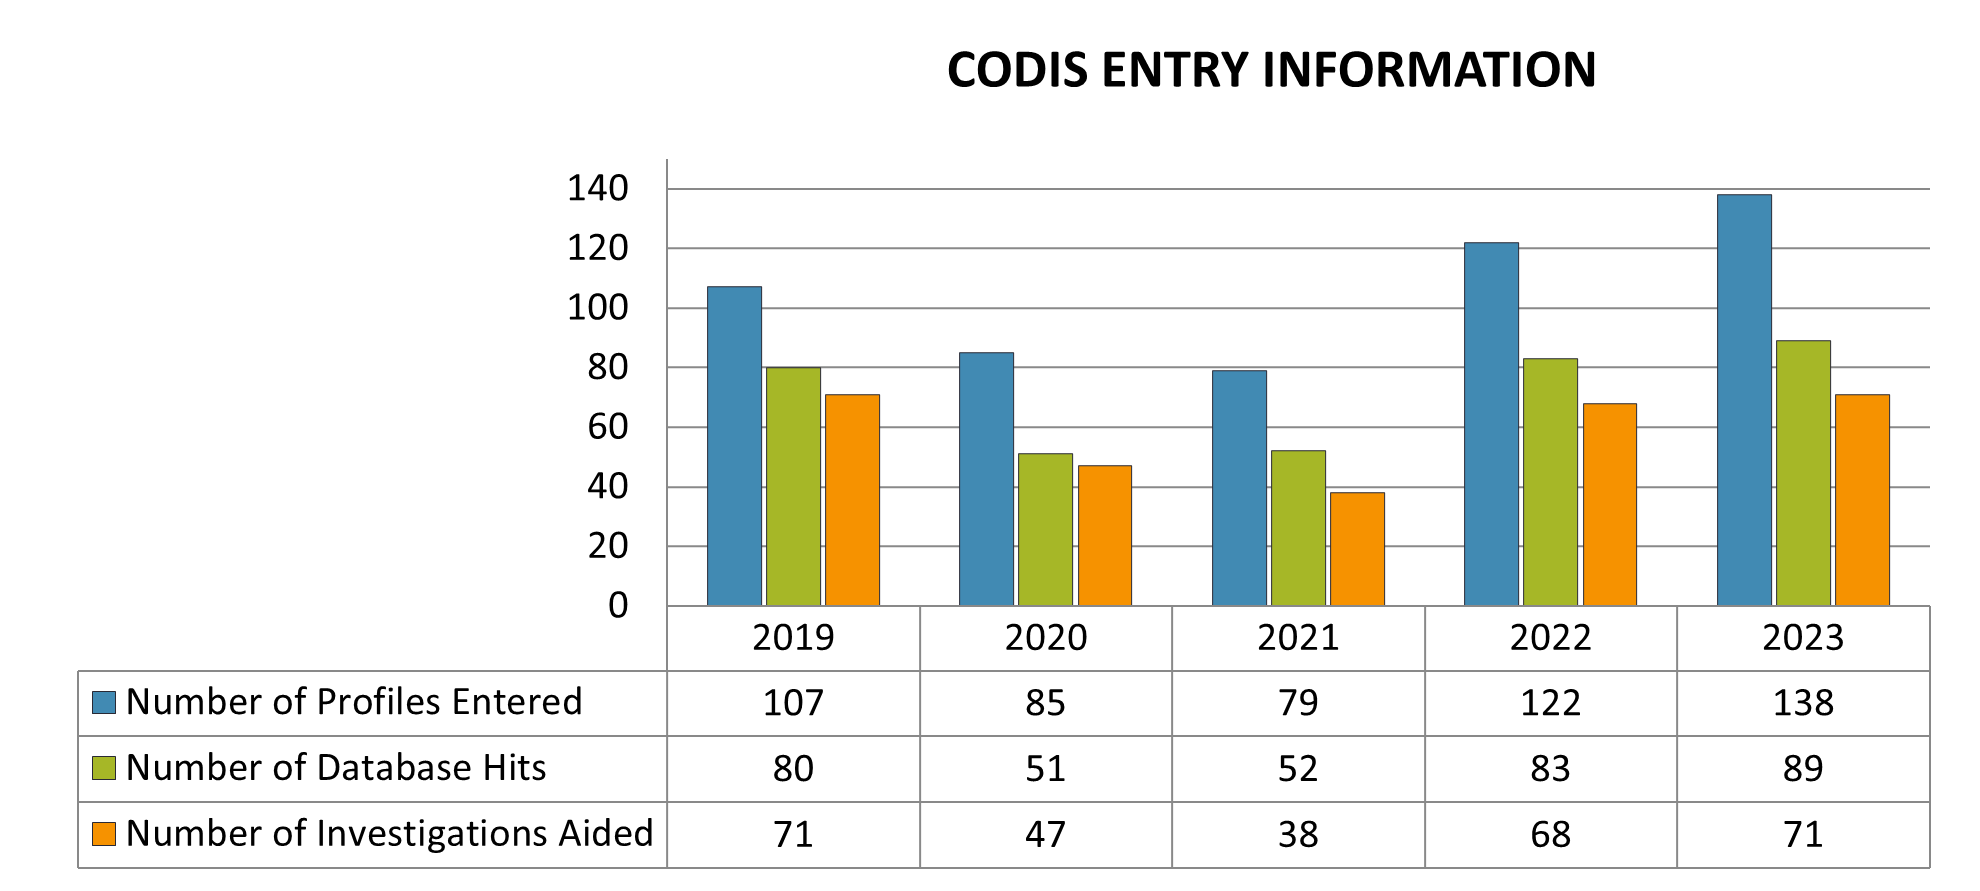
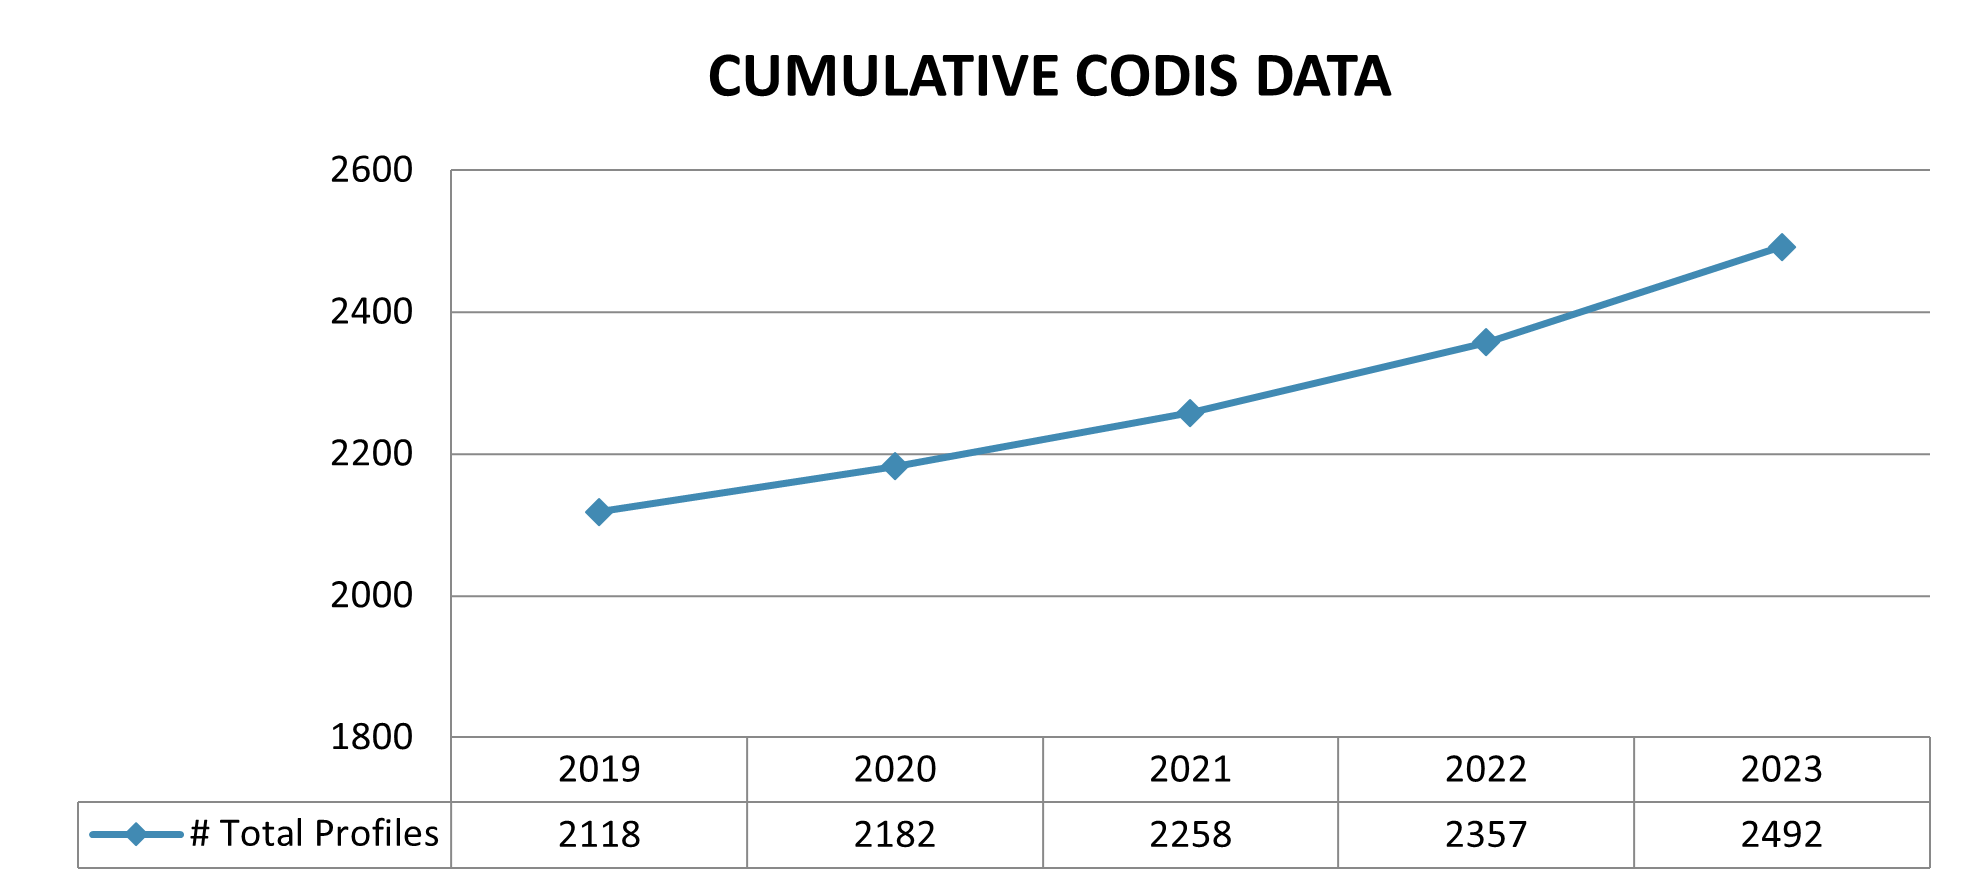
Trends in CODIS activity are illustrated in Figure 35 and Figure 36. In the last 5 years, the average number of case profiles entered into CODIS is 120, the average number of hits per year is approximately 82, and the average number of investigations aided per year is approximately 69.
| 2019 | 2020 | 2021 | 2022 | 2023 | |
|---|---|---|---|---|---|
| Number of Profiles | 107 | 85 | 79 | 122 | 138 |
| Number of Database Hits | 80 | 51 | 52 | 83 | 89 |
| Number of Investigations Aided | 71 | 47 | 38 | 68 | 71 |
| 2019 | 2020 | 2021 | 2022 | 2023 | |
|---|---|---|---|---|---|
| Total Number of Profiles | 2118 | 2182 | 2258 | 2357 | 2492 |
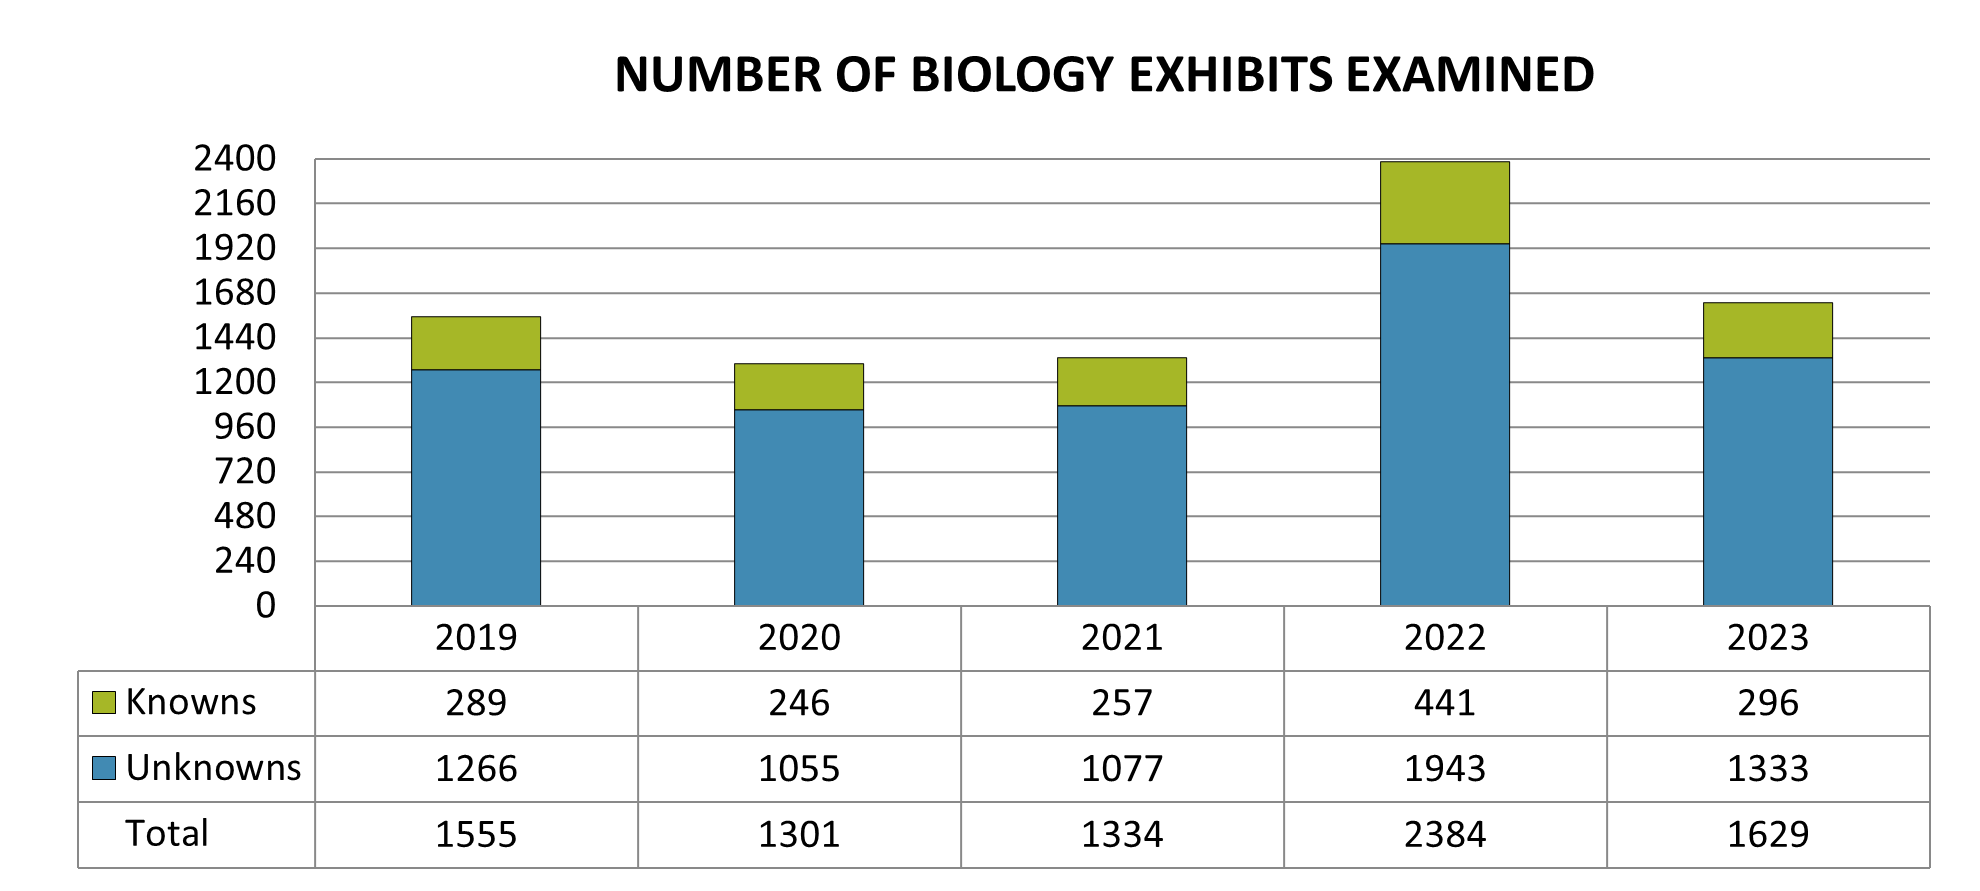
Unknown and Known Exhibits Examined
The Biology/DNA Laboratory examines unknown samples (Qs) from crime scene exhibits and known samples (Ks) collected from known individuals. The number of exhibits submitted in any given case can vary greatly. Some investigations may involve multiple scenes and individuals, while others require the testing of a single sample. Therefore, to reflect the workload of the section, it is often useful to also capture data involving the number of exhibits the section has tested or processed and the number of DNA profiles that required scientist interpretation and comparison.
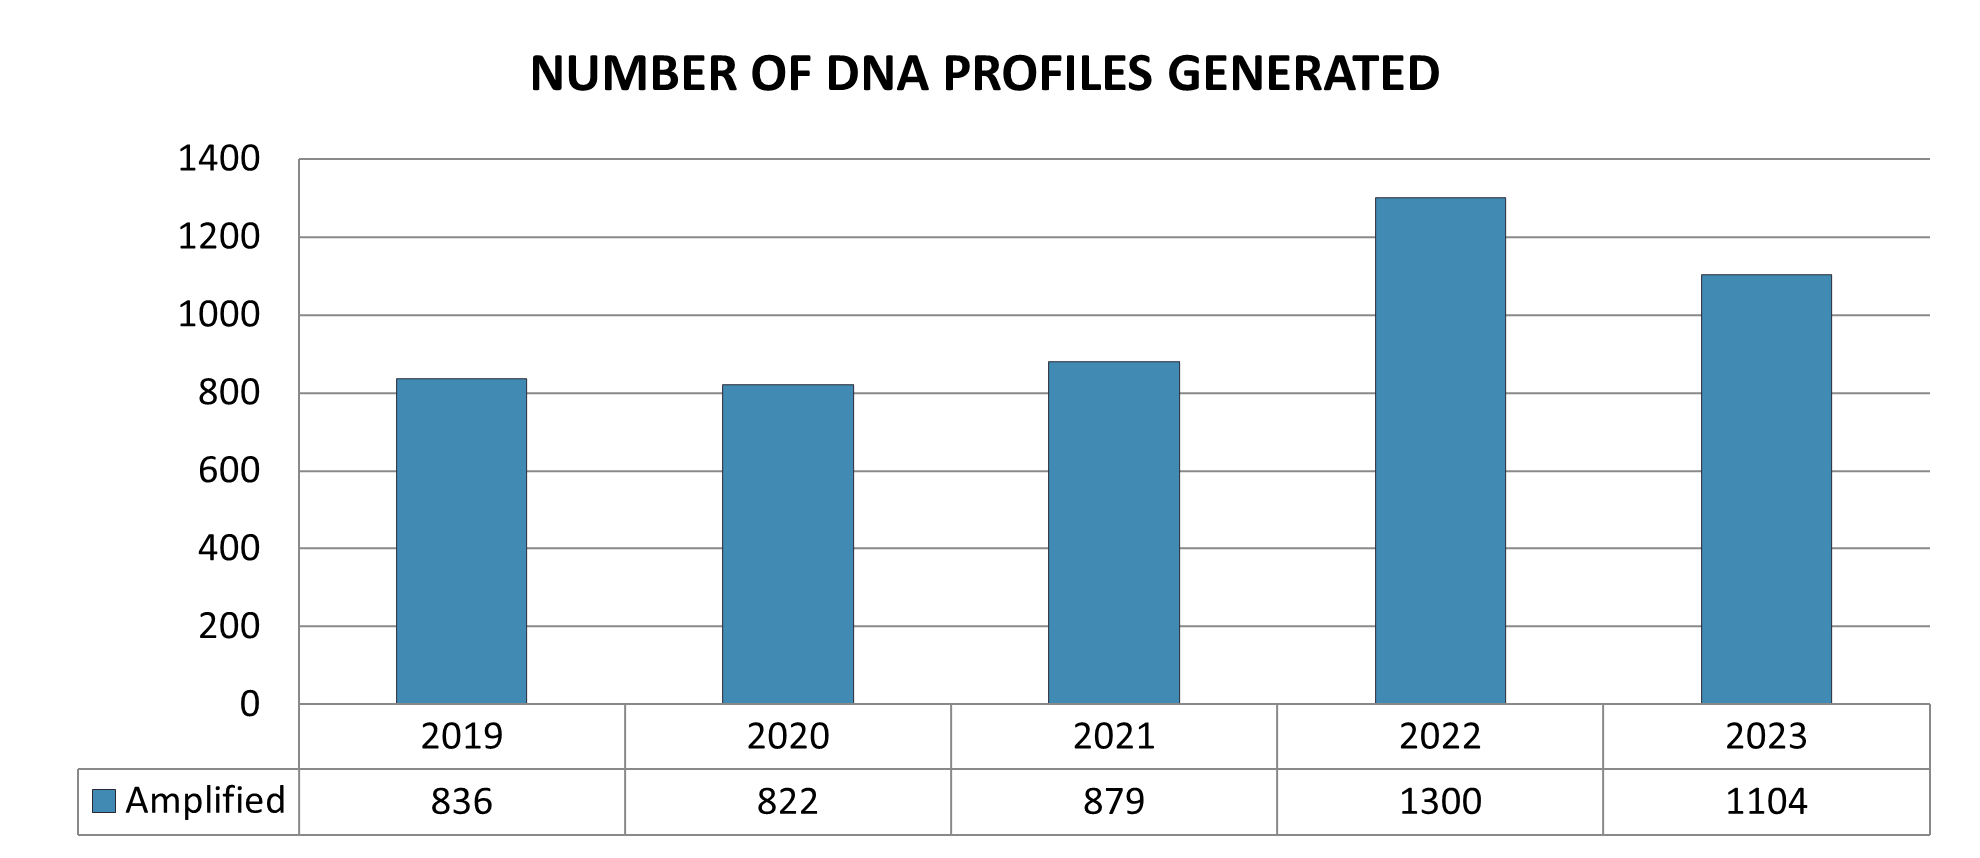
Figure 37 below illustrates the number of unknown and known exhibits examined by the laboratory over the past five years. Figure 38 below illustrates the number of DNA profiles generated by Polymerase Chain Reaction (PCR) from the unknown and known exhibits over the same period.
| 2019 | 2020 | 2021 | 2022 | 2023 | |
|---|---|---|---|---|---|
| Knowns | 289 | 246 | 257 | 441 | 296 |
| Unknowns | 1266 | 1055 | 1077 | 1943 | 1333 |
| Total | 1555 | 1301 | 1334 | 2384 | 1629 |
| 2019 | 2020 | 2021 | 2022 | 2023 | |
|---|---|---|---|---|---|
| Amplified | 836 | 822 | 879 | 1300 | 1104 |
Toxicology
The Toxicology Laboratory provides comprehensive examinations of postmortem (autopsy) samples to assist in the determination of cause and manner of death. Specimens collected during the investigation of driving under the influence of drugs and/or alcohol cases and drug-facilitated sexual assault cases are also examined by the Toxicology Laboratory. The Toxicology Laboratory also provides drug testing on children removed from clandestine methamphetamine laboratories.
Due to the continuously emerging drugs that are available for use and/or abuse, the laboratory is continuously expanding the number of drugs and poisons it can detect and quantitate.
A significant portion of samples submitted are from postmortem (PM) cases, the number of which is dependent upon the number of autopsies performed at the Center by the Pathology Division. The remaining portion of the cases are antemortem cases submitted for analysis by law enforcement agencies. These include DUI (driving under the influence), DUID (driving under the influence of drugs), DFSA (drug facilitated sexual assault) and other antemortem cases submitted by law enforcement agencies.
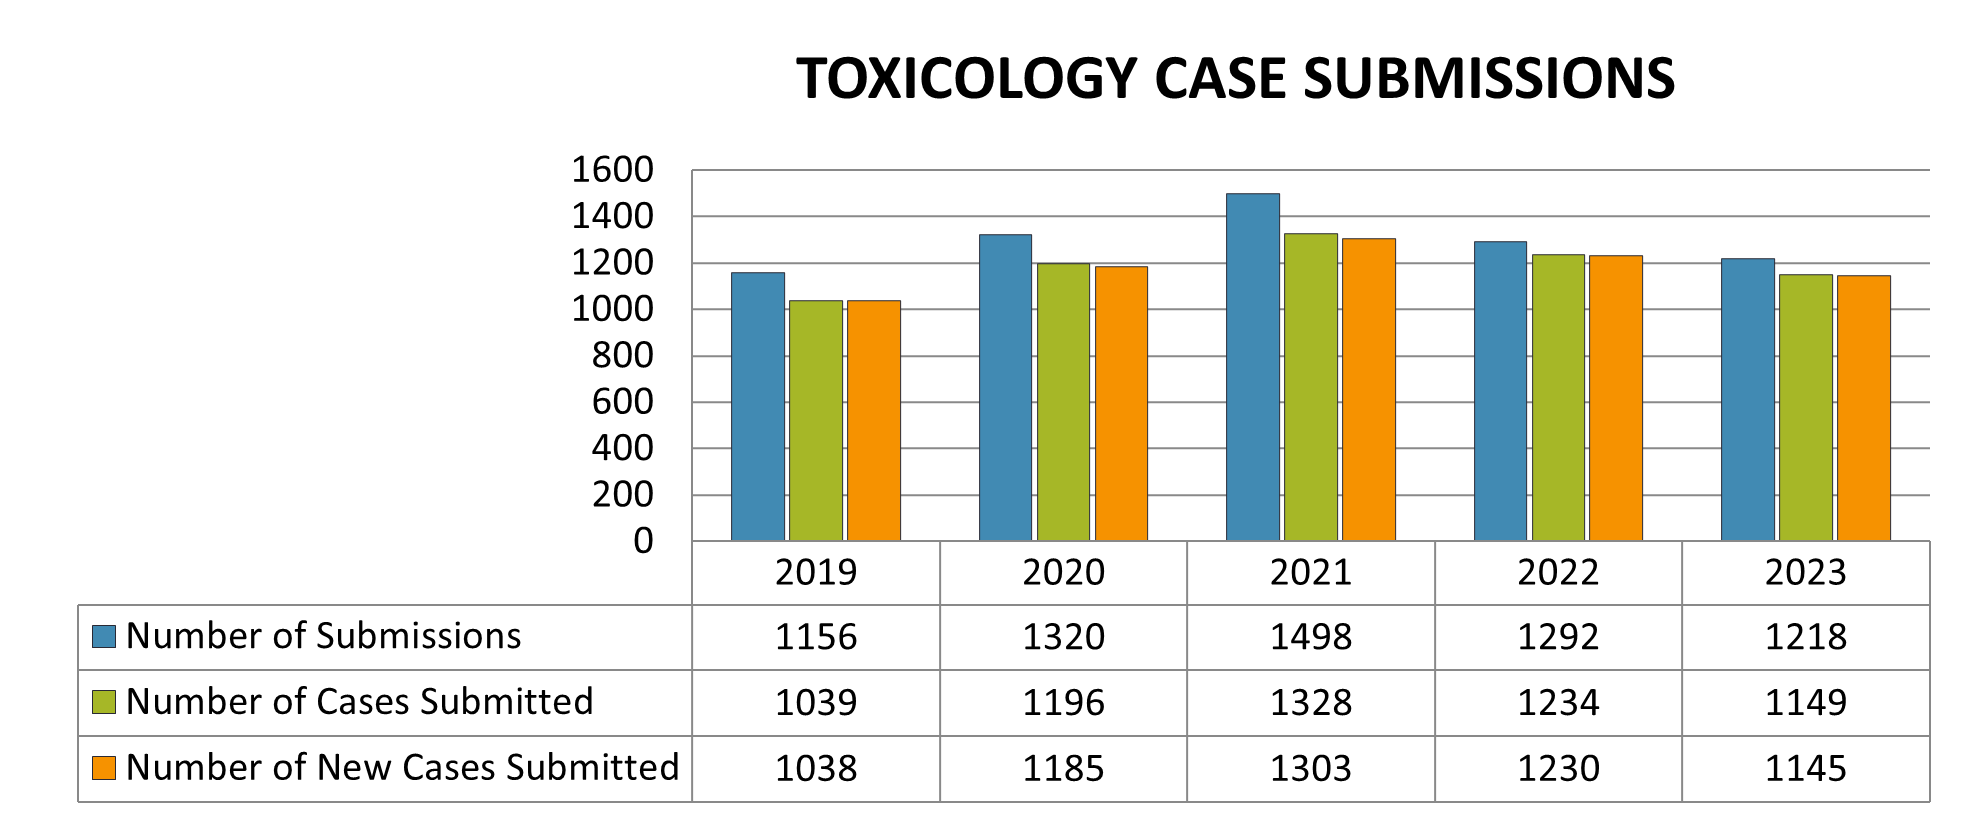
Illustrated in Figure 39 is the total number of case submissions, the number of cases submitted, and the number of new cases submitted to the Toxicology Laboratory over a 5-year period. The average number of new cases being submitted to the laboratory over the past 5 years is 1180.
| 2019 | 2020 | 2021 | 2022 | 2023 | |
|---|---|---|---|---|---|
| Number of Submissions | 1156 | 1320 | 1498 | 1292 | 1218 |
| Number of Cases Submitted | 1039 | 1196 | 1328 | 1234 | 1149 |
| Number of New Cases Submitted | 1038 | 1185 | 1303 | 1230 | 1145 |
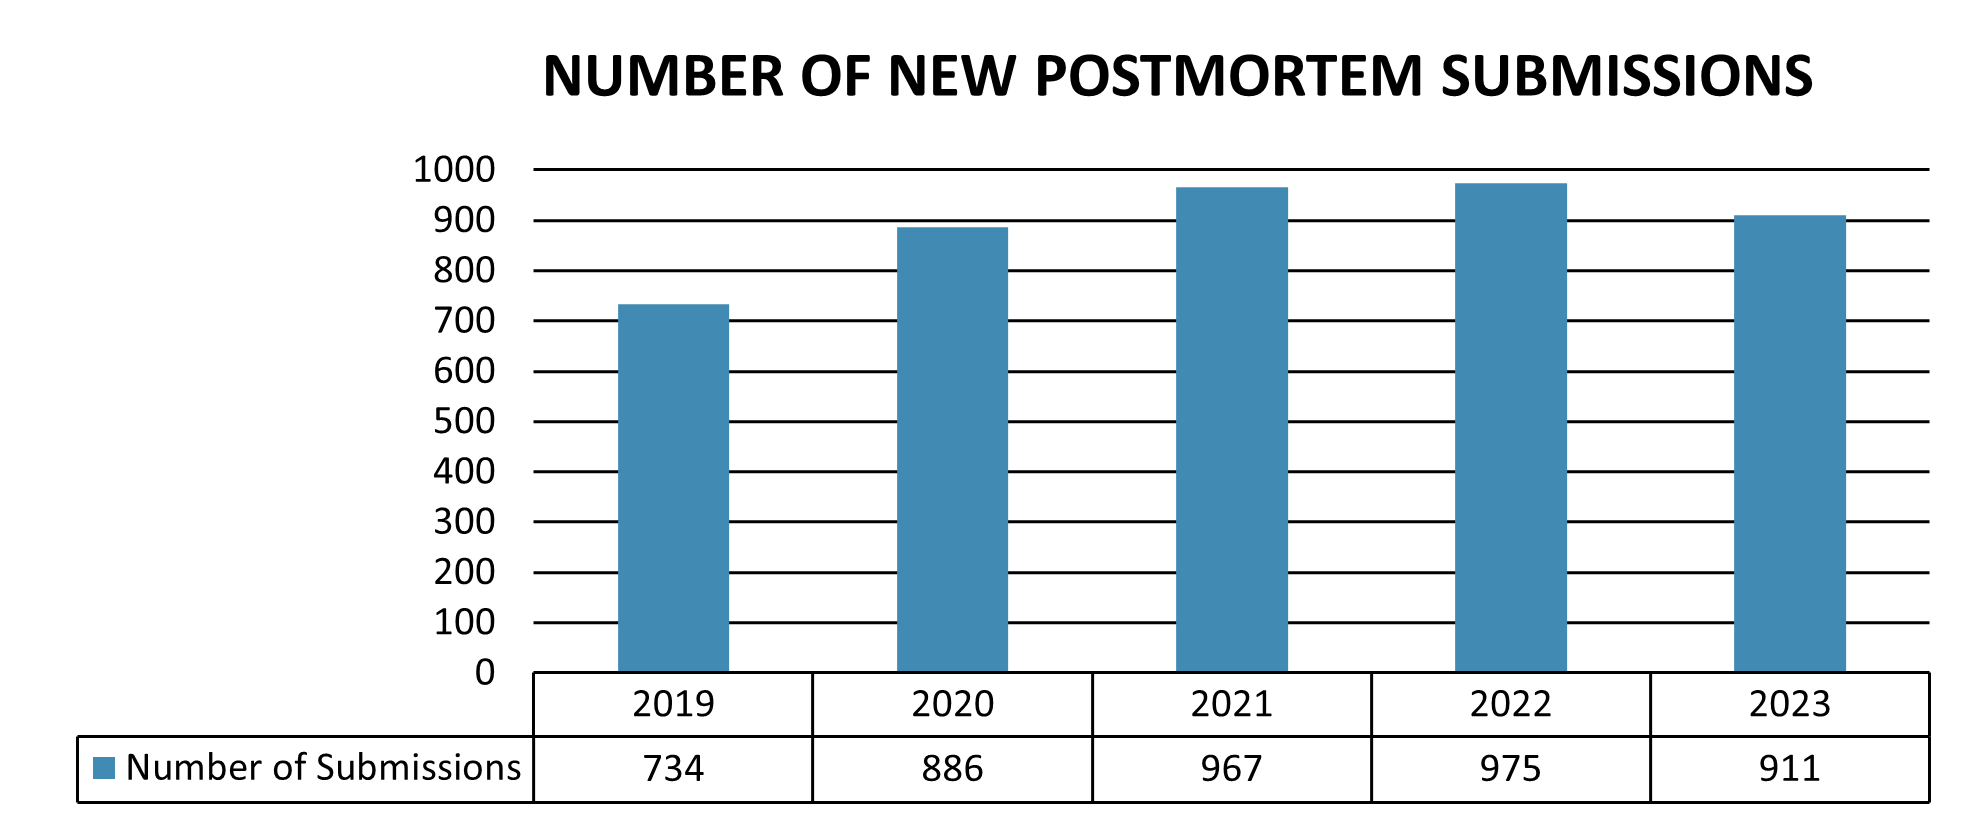
As illustrated in Figure 40 the number of new postmortem case submissions has increased from 734 in 2019 to 911 in 2023, which equates to an increase of approximately 24.1% of new postmortem case submissions since 2019.
| 2019 | 2020 | 2021 | 2022 | 2023 | |
|---|---|---|---|---|---|
| Number of Submissions | 734 | 886 | 967 | 975 | 911 |
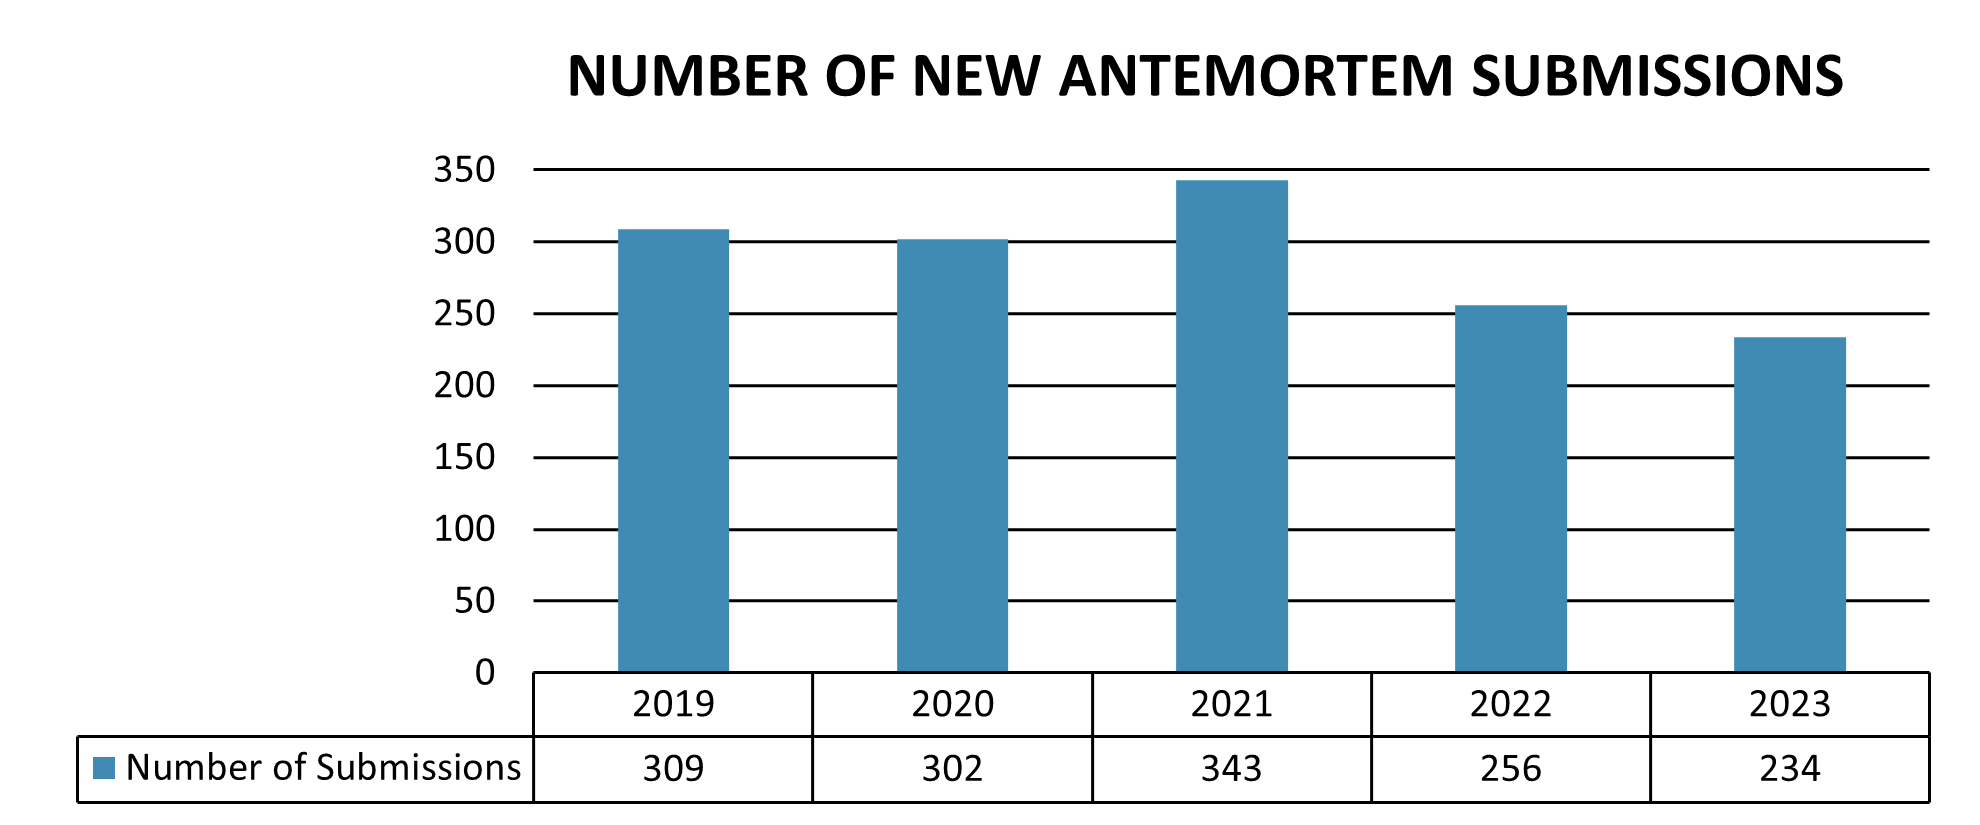
As illustrated in Figure 41 the number of new antemortem case submissions has decreased from 309 in 2019 to 234 in 2023, which equates to a decrease of approximately 24.2% of new antemortem case submissions since 2019.
| 2019 | 2020 | 2021 | 2022 | 2023 | |
|---|---|---|---|---|---|
| Number of Submissions | 309 | 302 | 343 | 256 | 234 |
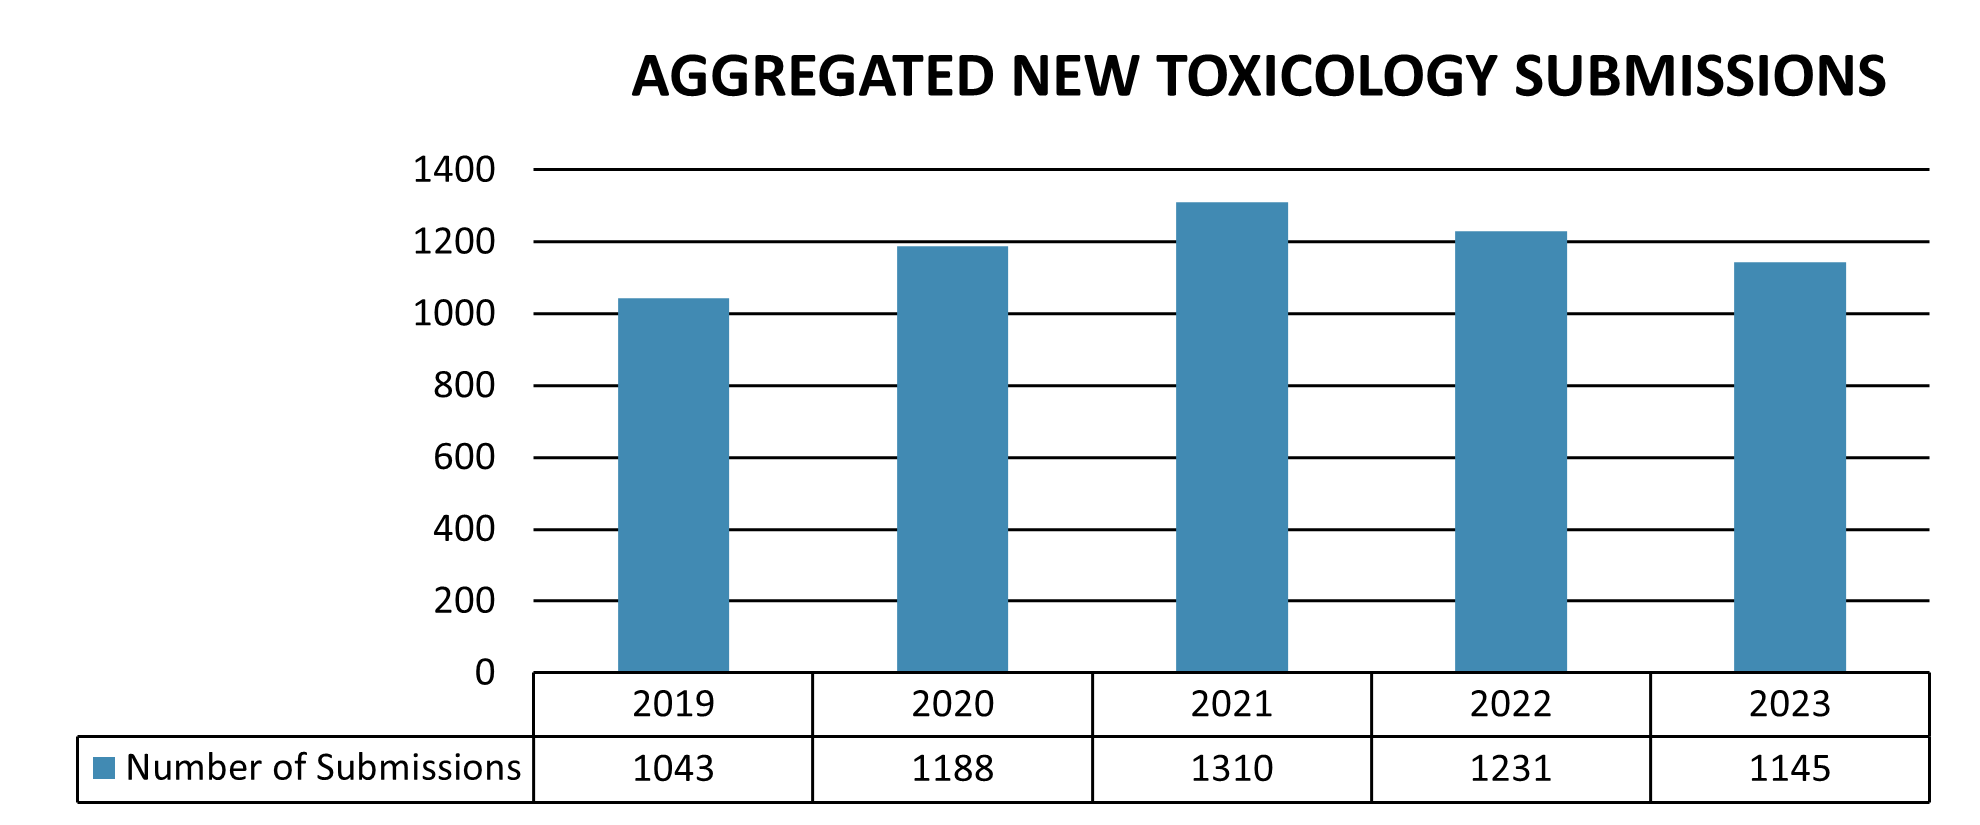
As illustrated in Figure 42 the number of total new case submissions to the Toxicology Laboratory has increased from 1043 in 2019 to 1145 in 2023, which equates to an increase of approximately 9.7% of new case submissions since 2019.
| 2019 | 2020 | 2021 | 2022 | 2023 | |
|---|---|---|---|---|---|
| Number of Submissions | 1043 | 1188 | 1310 | 1231 | 1145 |
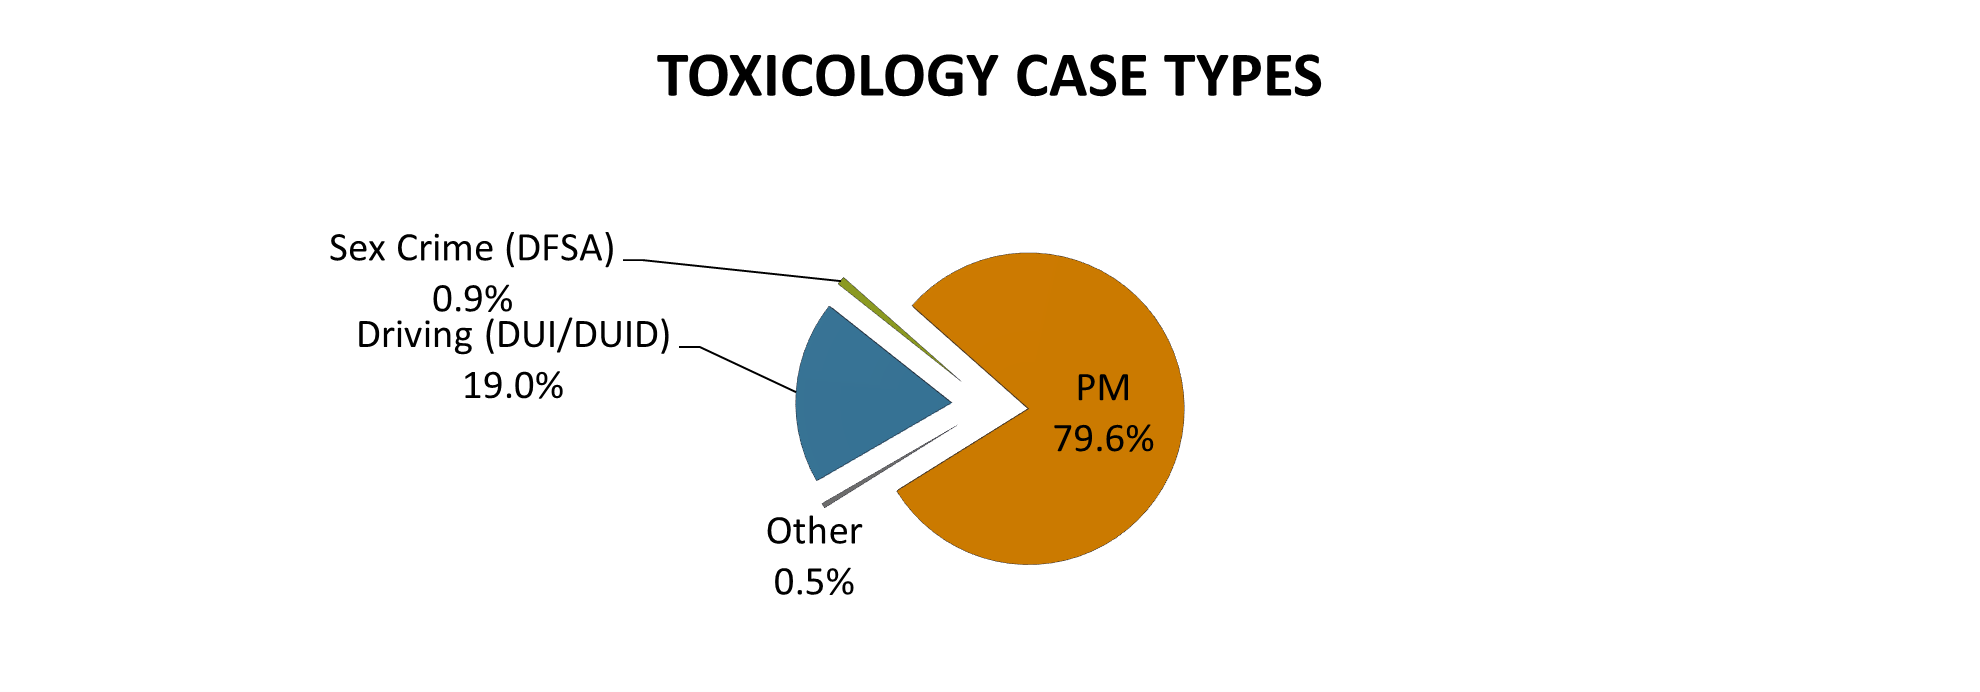
The percentage of toxicology cases submitted by case type is illustrated in Figure 43. Postmortem (PM) toxicological examinations in support of the District Coroner account for approximately 79.6% of the forensic case work performed by the laboratory.
| Postmortem | DUI/DUID | DFSA | Other | |
|---|---|---|---|---|
| Percentage of Case Types | 79.6 | 19.0 | 0.9 | 0.5 |
Postmortem Drugs Detected
Hundreds of different drugs can be detected in Postmortem Toxicology cases, including a wide range of illicit, prescription, and over the counter drugs. New drugs are constantly emerging on the illicit drug market providing a challenge to the toxicology laboratory. Table 3 illustrates the number of 2023 Postmortem Toxicology cases where the most frequently detected drugs and/or metabolites were detected. Of the 901 cases tested, there were a total of 157 different drugs and/or metabolites detected in 648 cases with confirmed analytical results.
Table 3: The most frequently detected drugs and/or metabolites detected in 2023 Postmortem Toxicology cases, with the percent of positive cases that each was detected. The remaining drugs and/or metabolites were detected in less than 10 cases. *Some positive morphine cases may be due to a delayed heroin related death.
| Drugs Detected in Postmortem Cases | Case Count | Percent of Positive Cases | Percent of All Cases |
|---|---|---|---|
|
Ethanol |
189 |
29.1 |
20.9 |
|
Methamphetamine |
177 |
27.3 |
19.6 |
|
Fentanyl |
171 |
26.3 |
18.9 |
|
Amphetamine |
168 |
25.9 |
18.6 |
|
Norfentanyl |
143 |
22.0 |
15.8 |
|
Delta-9 THC |
111 |
17.1 |
12.3 |
|
Benzoylecgonine |
69 |
10.6 |
7.6 |
|
Delta-9 Carboxy-THC |
62 |
9.5 |
6.8 |
|
Naloxone |
61 |
9.4 |
6.7 |
|
Oxycodone |
39 |
6.0 |
4.3 |
|
Carboxytetrahydrocannabinol |
36 |
5.5 |
3.9 |
|
Hydrocodone |
34 |
5.2 |
3.7 |
|
Cocaine |
32 |
4.9 |
3.5 |
|
Diphenhydramine |
30 |
4.6 |
3.3 |
|
Hydromorphone |
28 |
4.3 |
3.1 |
|
Morphine* |
27 |
4.1 |
2.9 |
|
Gabapentin |
25 |
3.8 |
2.7 |
|
4-ANPP |
23 |
3.5 |
2.5 |
|
Oxymorphone |
23 |
3.5 |
2.5 |
|
Amiodarone |
21 |
3.2 |
2.3 |
|
Citalopram/Escitalopram |
20 |
3.0 |
2.2 |
|
Lorazepam |
20 |
3.0 |
2.2 |
|
Acetaminophen |
19 |
2.9 |
2.1 |
|
Alprazolam |
18 |
2.7 |
1.9 |
|
EDDP |
17 |
2.6 |
1.8 |
|
Methadone |
17 |
2.6 |
1.8 |
|
Trazodone |
17 |
2.6 |
1.8 |
|
Caboxyhemoglobin [HbCO] |
16 |
2.4 |
1.7 |
|
Hydroxyzine |
16 |
2.4 |
1.7 |
|
7-Aminoclonazepam |
15 |
2.3 |
1.6 |
|
Cocaethylene |
15 |
2.3 |
1.6 |
|
Desmethylsertraline |
15 |
2.3 |
1.6 |
|
Sertraline |
13 |
2.0 |
1.4 |
|
Quetiapine |
12 |
1.8 |
1.3 |
|
Metoprolol |
11 |
1.6 |
1.2 |
|
Tramadol |
11 |
1.6 |
1.2 |
|
Alpha-OH-alprazolam |
10 |
1.5 |
1.1 |
|
Cyclobenzaprine |
10 |
1.5 |
1.1 |
|
Delta-8 THC |
10 |
1.5 |
1.1 |
|
Dihydrocodeine |
10 |
1.5 |
1.1 |
|
Midazolam |
10 |
1.5 |
1.1 |
Overdose/Drug Related
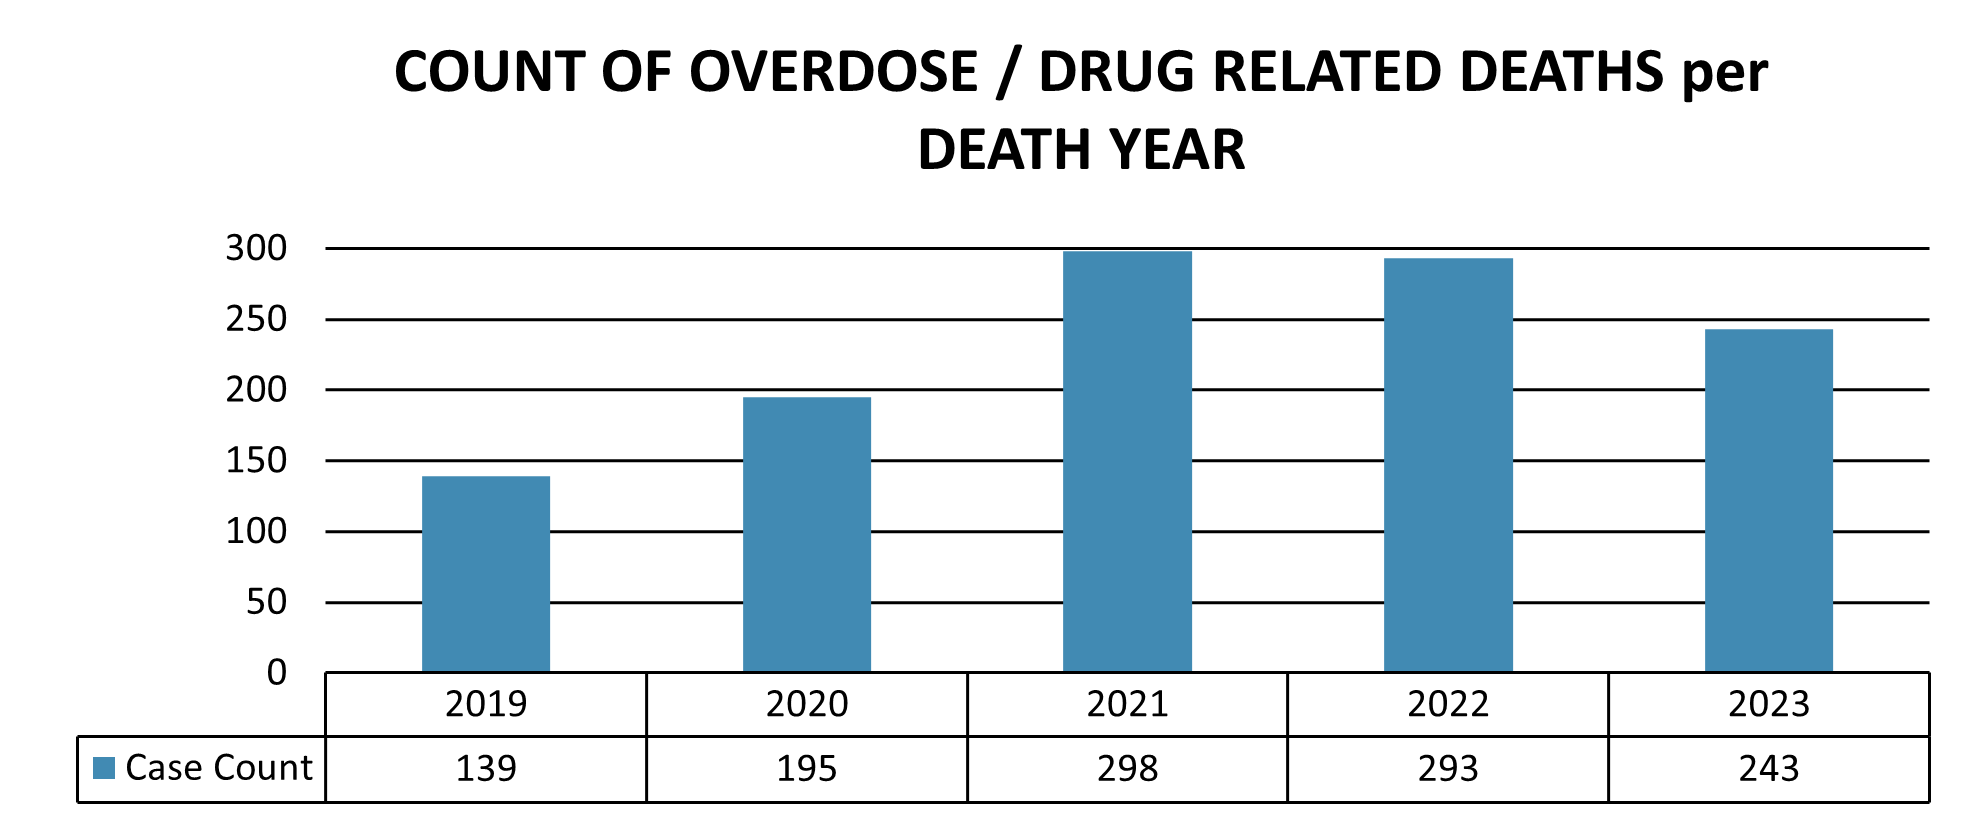
Overdose/Drug related deaths can be either accidental or intentional. Methamphetamine or an opioid are very commonly detected by the Toxicology Laboratory in the specimens collected at autopsy. In 2023, there were a total of 243 overdose/drug related fatalities, which equates to an approximate 74.8% increase from 2019 [Figure 44].
| 2019 | 2020 | 2021 | 2022 | 2023 | |
|---|---|---|---|---|---|
| Case Count | 139 | 195 | 298 | 293 | 243 |
Opioid Positive Drug Related Deaths
Figure 45 illustrates the number of drug related deaths that tested positive for an opioid between 2019 and 2023. As illustrated, in 2023 the number of opioid deaths continued to trend downwards when compared to 2021 and 2022.
| 2019 | 2020 | 2021 | 2022 | 2023 | |
|---|---|---|---|---|---|
| Total | 143 | 180 | 259 | 224 | 173 |
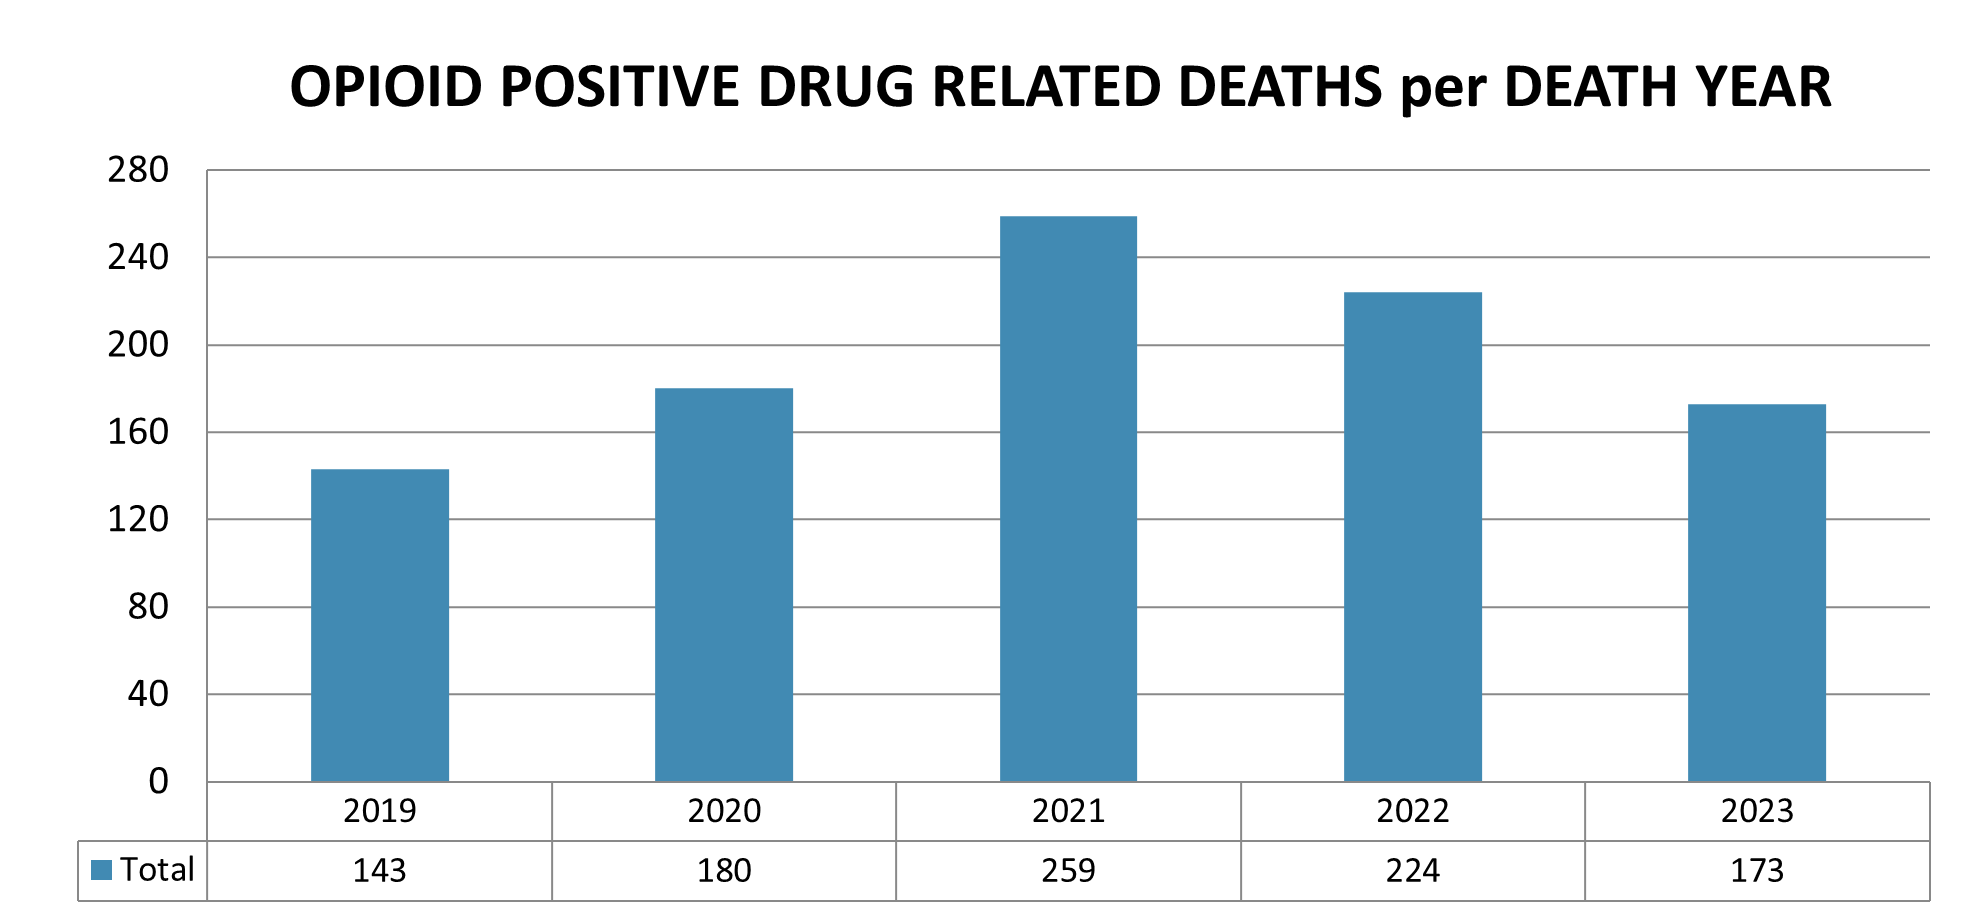
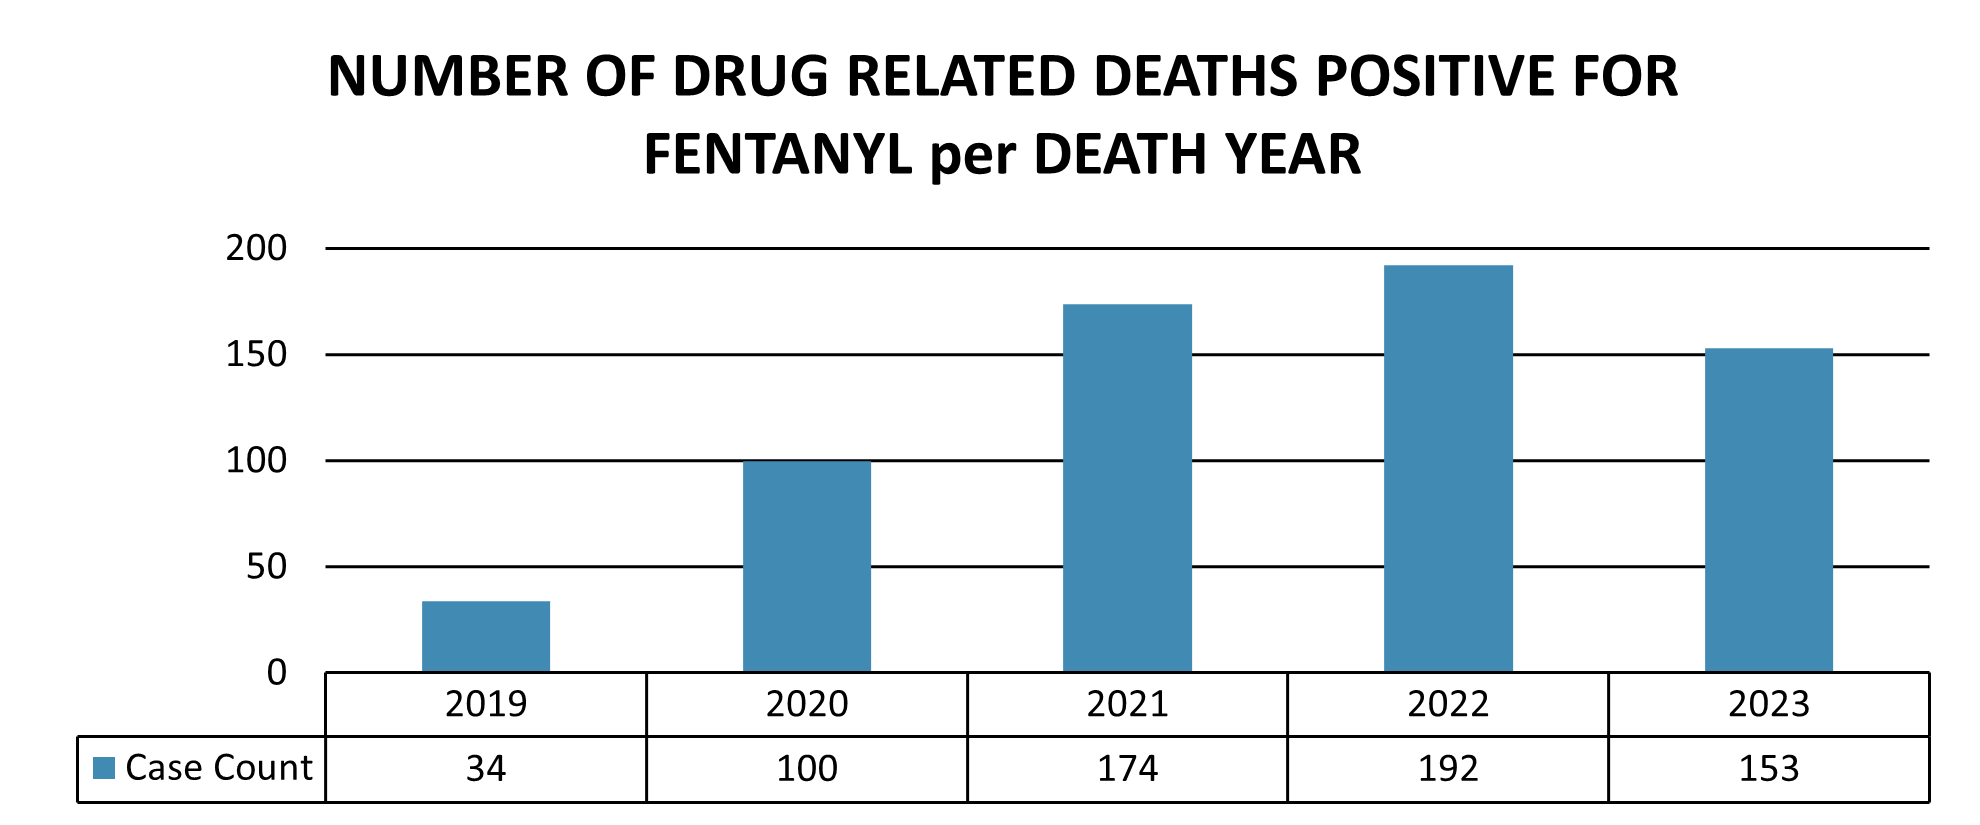
Figure 46 illustrates the number of fentanyl-related deaths per submission year since 2019; fentanyl is the most commonly detected opioid in postmortem cases.
| 2019 | 2020 | 2021 | 2022 | 2023 | |
|---|---|---|---|---|---|
| Case Count | 34 | 100 | 174 | 192 | 153 |
Listed in Table 4 is the number of cases that each opioid was detected in Postmortem Toxicology specimens per submission year.
| Opioids Detected in Postmortem Specimens | 2019 | 2020 | 2021 | 2022 | 2023 |
|
6-Monoacetylmorphine (Heroin metabolite) |
17 | 22 | 21 | 11 | 1 |
|
6-Beta-Naltrexol |
0 | 0 | 0 | 0 | 1 |
|
Acetyl fentanyl |
0 | 0 | 0 | 1 | 0 |
|
Buprenorphine |
1 | 0 | 0 | 1 | 3 |
|
Codeine |
7 | 6 | 11 | 10 | 7 |
|
Dihydrocodeine |
0 | 0 | 5 | 3 | 10 |
|
Dihydrocodeine/Hydrocodol |
0 | 0 | 0 | 0 | 4 |
|
EDDP |
2 | 0 | 0 | 9 | 17 |
|
Fentanyl |
32 | 100 | 174 | 269 | 173 |
|
Fluorofentanyl |
0 | 0 | 0 | 0 | 3 |
|
Hydrocodone |
27 | 25 | 25 | 44 | 34 |
|
Hydromorphone |
4 | 8 | 12 | 10 | 28 |
|
Loperamide |
0 | 0 | 0 | 1 | 2 |
|
Methadone |
21 | 11 | 15 | 23 | 17 |
|
Mitragynine |
1 | 4 | 1 | 5 | 7 |
|
Morphine* |
40 | 38 | 42 | 30 | 27 |
|
N-Desmethyltramadol |
0 | 0 | 2 | 0 | 0 |
|
Norbuprenorphine |
0 | 1 | 8 | 2 | 1 |
|
Norfentanyl |
3 | 78 | 140 | 213 | 143 |
|
O-Desmethyltramadol |
0 | 0 | 7 | 7 | 8 |
|
Oxycodone |
19 | 24 | 38 | 39 | 39 |
|
Oxymorphone |
3 | 2 | 7 | 13 | 23 |
|
Para-Fluorofentanyl |
0 | 0 | 0 | 0 | 1 |
|
Propofol |
2 | 0 | 1 | 0 | 0 |
|
Tramadol |
10 | 9 | 10 | 10 | 11 |
Table 5 illustrates the count of fentanyl related deaths in 2023 within each age group and whether the death occurred within Sedgwick County or another jurisdiction. The greatest number of deaths related to fentanyl occurred in the 30- to 39-year-old age group.
| Age Group | Number of Deaths (All Counties) | Number of Deaths (Sedwick County) |
|---|---|---|
| 0-18 | 3 | 3 |
| 19-29 | 19 | 18 |
| 30-39 | 41 | 41 |
| 40-49 | 24 | 24 |
| 50-59 | 25 | 25 |
| 60-69 | 9 | 8 |
| 70-79 | 1 | 1 |
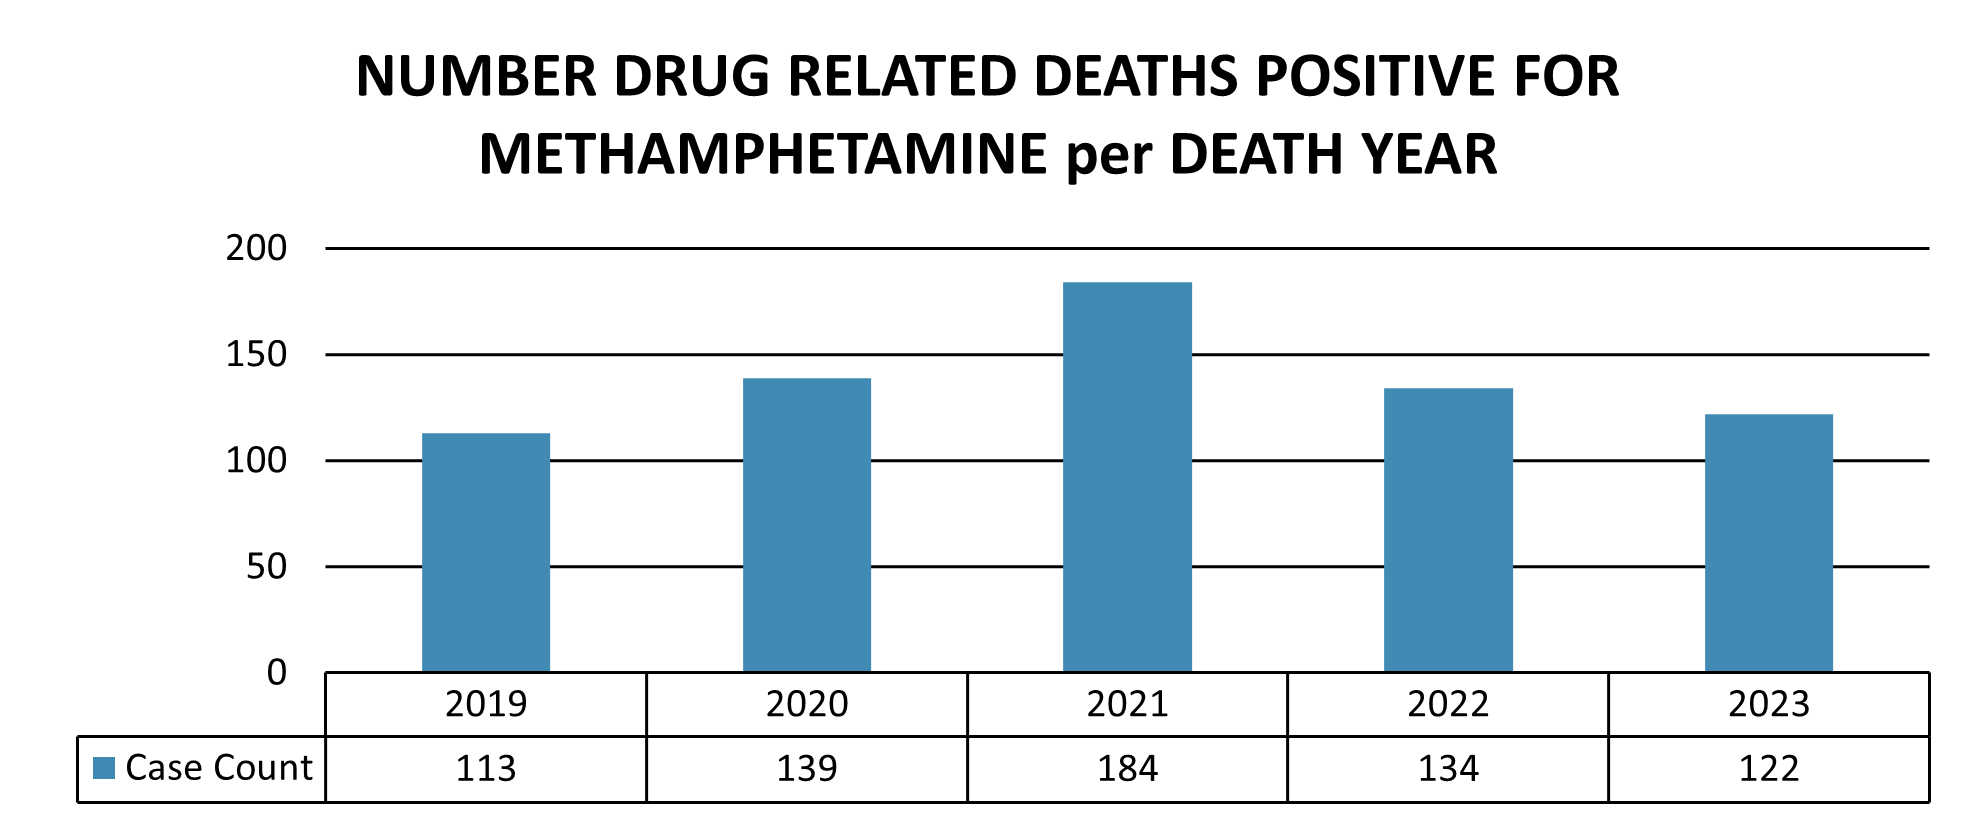
Methamphetamine Positive Drug Related Deaths
Drug related deaths that test positive for methamphetamine continue to be a significant portion of the drug related deaths that occur. Figure 47 illustrates the number of drug related deaths that tested positive for methamphetamine since 2019 per death year.
| 2019 | 2020 | 2021 | 2022 | 2023 | |
|---|---|---|---|---|---|
| Case Count | 113 | 139 | 184 | 134 | 122 |
Drugs and Alcohol in Driving Cases
Many driving cases involve drivers that are under the influence of drugs and/or alcohol (ethanol). Table 6 provides the number of positively identified drugs from the 201 Blood Draw Kits submitted for analysis in 2023. Driving case violations may include, but not limited to, DUI/DUID (Driving Under the Influence of Alcohol/Drugs), various drug violations, vehicular homicide, vehicular fatality, evading police, and hit and run. In total there were 37 uniquely identified individual drugs, drug metabolites, and/or alcohol totaling 497 substances from the 201 cases submitted.
| Drugs Detected in Antemortem Driving Cases | 2019 | 2020 | 2021 | 2022 | 2023 |
|---|---|---|---|---|---|
|
11-Hydroxy-Delta-9-THC |
0 | 0 | 0 | 1 | 0 |
|
7-Aminoclonazepam |
8 | 9 | 6 | 5 | 5 |
|
a-Hydroxyalprazolam |
0 | 0 | 0 | 0 | 6 |
|
Alprazolam |
18 | 18 | 20 | 11 | 14 |
|
Amphetamine |
40 | 43 | 40 | 41 | 45 |
|
Benzoylecgonine |
9 | 9 | 21 | 13 | 9 |
|
Bromazolam |
0 | 0 | 1 | 1 | 3 |
|
Butalbital |
0 | 1 | 1 | 2 | 0 |
|
Cannabidiol [CBD] |
0 | 0 | 0 | 0 | 3 |
|
Carboxytetrahydrocannabinol^ |
2 | 1 | 0 | 0 | 0 |
|
Carisoprodol |
2 | 0 | 3 | 2 | 1 |
|
Clonazolam |
9 | 10 | 5 | 3 | 5 |
|
Clonazepam |
9 | 10 | 5 | 3 | 5 |
|
Cocaethylene |
1 | 0 | 0 | 1 | 3 |
|
Cocaine |
4 | 0 | 3 | 5 | 5 |
|
0Codeine |
0 | 0 | 2 | 1 | 0 |
|
Delta-8-Carboxy-THC^ |
0 | 0 | 0 | 5 | 16 |
|
Delta-8-THC^ |
0 | 0 | 0 | 3 | 11 |
|
Delta-9-Carboxy-THC^ |
0 | 0 | 0 | 16 | 71 |
|
Delta-9-THC^ |
0 | 0 | 0 | 13 | 70 |
|
Diazepam |
1 | 0 | 6 | 0 | 2 |
|
Difluoroethane |
2 | 3 | 1 | 2 | 1 |
|
Doxylamine |
0 | 1 | 0 | 0 | 0 |
|
EDDP |
0 | 0 | 0 | 0 | 4 |
|
Es/Citalopram |
0 | 1 | 0 | 0 | 0 |
|
Ethanol |
115 | 106 | 125 | 69 | 81 |
|
Etizolam |
1 | 3 | 0 | 0 | 0 |
|
Fentanyl |
7 | 17 | 57 | 33 | 30 |
|
Flualprazolam |
7 | 13 | 0 | 0 | 0 |
|
Flubromazepam |
2 | 1 | 0 | 0 | 0 |
|
Flubromazolam |
2 | 3 | 0 | 0 | 0 |
|
Fluoxetine |
0 | 0 | 1 | 0 | 0 |
|
Gabapentin |
1 | 1 | 2 | 0 | 0 |
|
Hydrocodone |
3 | 3 | 5 | 10 | 2 |
|
Hydromorphone |
0 | 0 | 1 | 0 | 2 |
|
Lamotrigine |
0 | 0 | 1 | 0 | 0 |
|
Levetiracetam |
1 | 0 | 0 | 0 | 0 |
|
Lorazepam |
2 | 0 | 2 | 4 | 1 |
|
Meprobamate |
2 | 2 | 5 | 2 | 1 |
|
Methadone |
8 | 8 | 13 | 9 | 5 |
|
Methamphetamine |
34 | 52 | 60 | 52 | 50 |
|
Methylenedioxyamphetamine |
0 | 2 | 1 | 0 | 0 |
|
Methylenedioxymethamphetamine |
0 | 1 | 2 | 0 | 0 |
|
Midazolam |
0 | 0 | 0 | 0 | 1 |
|
Mitragynine |
1 | 0 | 0 | 0 | 0 |
|
Morphine |
4 | 8 | 6 | 1 | 1 |
|
Norbuprenorphine |
0 | 1 | 0 | 0 | 0 |
|
Nordiazepam |
3 | 3 | 7 | 0 | 2 |
|
Norfentanyl |
1 | 14 | 49 | 30 | 28 |
|
Norfluoxetine |
0 | 0 | 1 | 0 | 0 |
|
O-Desmethyltramadol |
0 | 2 | 0 | 0 | 1 |
|
Oxazepam |
1 | 1 | 0 | 0 | 0 |
|
Oxycodone |
6 | 7 | 9 | 2 | 5 |
|
Oxymorphone |
1 | 1 | 0 | 0 | 0 |
|
Phenazepam |
1 | 0 | 0 | 0 | 0 |
|
Phencyclidine |
3 | 5 | 5 | 1 | 2 |
|
Phenobarbital |
1 | 0 | 0 | 1 | 1 |
|
Quetiapine |
1 | 0 | 0 | 0 | 0 |
|
Sertraline |
0 | 1 | 0 | 0 | 0 |
|
Temazepam |
0 | 2 | 1 | 0 | 1 |
|
Tetrahydrocannabinol (THC) |
74 | 81 | 84 | 49 | 0 |
|
Tramadol |
0 | 1 | 0 | 0 | 1 |
|
Trazodone |
0 | 0 | 1 | 0 | 0 |
|
Venlafaxine |
0 | 1 | 0 | 0 | 0 |
|
Zolpidem |
5 | 3 | 3 | 5 | 8 |
Drug-Facilitated Sexual Assaults
Drug-facilitated sexual assaults (DFSA) are a demanding type of forensic investigation. The cases often involve a perpetrator who will surreptitiously administer a drug to a victim to render them unconscious and sexually assault them. As illustrated in Table 7, in 2023 there were 10 DFSA cases submitted for analysis.
|
Year |
Cases Submitted |
|---|---|
|
2019 |
26 |
|
2020 |
15 |
|
2021 |
18 |
|
2022 |
10 |
|
2023 |
10 |
DFSA case specimens often have several different drugs present. Table 8 illustrates the number of positively identified drugs, drug metabolites, and/or alcohol detected in DFSA specimens. For comparison purposes the number of positive results for the drugs, drug metabolites, and/or alcohol is provided for each of the last 5 years. In total there were 24 individual drugs, drug metabolites, and/or alcohol detected for a total of 46 drugs, drug metabolites, and/or alcohol for cases submitted in 2023.
|
Drugs Detected in Drug Facilitated Sexual Assault Cases per Submission Year |
2019 |
2020 |
2021 |
2022 |
2023 |
|---|---|---|---|---|---|
|
7-Aminoclonazepam |
1 |
2 |
1 |
2 |
0 |
|
a-Hydroxyalprazolam |
1 |
0 |
1 |
0 |
1 |
|
Acetone |
- |
- |
- |
2 |
3 |
|
Alprazolam |
1 |
0 |
0 |
0 |
1 |
|
Amitriptyline |
1 |
0 |
0 |
0 |
0 |
|
Amphetamine |
5 |
1 |
8 |
4 |
3 |
|
Anhydroecgonine methyl ester |
0 |
0 |
0 |
0 |
1 |
|
Benzoylecgonine |
3 |
3 |
4 |
1 |
2 |
|
Bupropion |
0 |
0 |
0 |
1 |
0 |
|
Bupropion threo amino alcohol |
0 |
0 |
1 |
0 |
0 |
|
Carboxytetrahydrocannabinol^ |
13 |
5 |
9 |
5 |
5 |
|
Chlorcyclizine |
1 |
1 |
2 |
0 |
0 |
|
Clonazepam |
0 |
1 |
0 |
1 |
0 |
|
Cocaethylene |
0 |
0 |
1 |
0 |
1 |
|
Cocaine |
0 |
0 |
2 |
0 |
2 |
|
Codeine |
1 |
0 |
0 |
0 |
0 |
|
Delta-8-Carboxy-THC^ |
0 |
0 |
0 |
0 |
2 |
|
Delta-8-THC^ |
0 |
0 |
0 |
0 |
1 |
|
Delta-9-Carboxy-THC^ |
0 |
0 |
0 |
0 |
4 |
|
Delta-9-THC^ |
0 |
0 |
0 |
0 |
3 |
|
Desmethyl(es-)citalopram |
1 |
1 |
2 |
0 |
2 |
|
Dextromethorphan |
0 |
0 |
0 |
0 |
1 |
|
Diphenhydramine |
4 |
4 |
1 |
1 |
2 |
|
Doxylamine |
0 |
0 |
0 |
1 |
1 |
|
Ecgonine ethyl ester |
0 |
0 |
2 |
0 |
1 |
|
Ecgonine methyl ester |
0 |
0 |
2 |
0 |
0 |
|
Es/citalopram |
1 |
1 |
2 |
0 |
2 |
|
Ethanol |
8 |
5 |
4 |
2 |
3 |
|
Fentanyl |
0 |
0 |
0 |
1 |
0 |
|
Flubromazolam |
1 |
0 |
0 |
0 |
0 |
|
Fluoxetine |
1 |
0 |
2 |
2 |
0 |
|
Gabapentin |
2 |
0 |
0 |
1 |
0 |
|
Hydrocodone |
0 |
0 |
1 |
0 |
0 |
|
Hydromorphone |
0 |
0 |
1 |
0 |
0 |
|
Hydroxybupropion |
0 |
0 |
0 |
1 |
0 |
|
Hydroxyzine |
1 |
0 |
0 |
0 |
0 |
|
Lamotrigine |
0 |
0 |
0 |
2 |
0 |
|
Lidocaine |
0 |
1 |
1 |
0 |
0 |
|
Lorazepam |
2 |
2 |
0 |
2 |
1 |
|
m-Chlorophenylpiperazine |
0 |
0 |
0 |
1 |
0 |
|
Methamphetamine |
7 |
1 |
7 |
4 |
1 |
|
Morphine |
1 |
0 |
0 |
1 |
0 |
|
N-Desmethyltramadol |
1 |
0 |
0 |
0 |
0 |
|
Norcocaine |
0 |
0 |
0 |
0 |
1 |
|
Nordiphenhydramine |
3 |
4 |
1 |
1 |
2 |
|
Norfentanyl |
0 |
0 |
1 |
1 |
0 |
|
Norfluoxetine |
1 |
0 |
2 |
2 |
0 |
|
Norquetiapine |
0 |
0 |
1 |
0 |
0 |
|
O-Desmethyltramadol |
2 |
0 |
0 |
1 |
0 |
|
O-Desmethylvenlafaxine |
0 |
0 |
1 |
1 |
0 |
|
Oxazepam |
1 |
0 |
0 |
1 |
0 |
|
Oxycodone |
1 |
0 |
0 |
1 |
0 |
|
Oxymorphone |
1 |
0 |
0 |
1 |
0 |
|
Phencyclidine |
0 |
1 |
0 |
0 |
0 |
|
Promethazine |
2 |
2 |
0 |
1 |
0 |
|
Quetiapine |
0 |
0 |
0 |
1 |
0 |
|
Salicylic Acid |
1 |
0 |
0 |
0 |
0 |
|
Sertraline |
1 |
0 |
0 |
1 |
0 |
|
Temazepam |
1 |
0 |
0 |
0 |
0 |
|
Tetrahydrocannabinol |
1 |
0 |
0 |
0 |
0 |
|
Toluene |
0 |
1 |
0 |
0 |
0 |
|
Tramadol |
2 |
2 |
0 |
1 |
0 |
|
Trazodone |
0 |
0 |
0 |
1 |
0 |
|
Tyramine |
0 |
0 |
0 |
1 |
0 |
|
Venlafaxine |
1 |
0 |
1 |
1 |
0 |