
2025 Laboratory Division Annual Report
Table of Contents
Forensic Science Laboratory Service Overview
Sedgwick County vs. Out-of-County Cases
Drugs and Alcohol in Driving Cases
Drug-Facilitated Sexual Assaults
Mission
The Sedgwick County Regional Forensic Science Center strives to provide the highest quality medicolegal and advanced Forensic Laboratory services to Sedgwick County and regional partners. Death Investigation and Forensic Autopsy services are conducted in a compassionate and objective manner to achieve accurate certification of cause and manner of death. The Forensic Laboratory services provide unbiased and accurate analytical testing to support the resolution of criminal cases. As an independent agency operating under the Division of Public Safety, the Forensic Science Center collaborates with public health and criminal justice stakeholders to reduce crime and prevent deaths.
Laboratory Leadership
Shelly Steadman, PhD / Director
Robert C. Hansen II, MSFS / Quality Assurance and Compliance Manager; LIMS Administrator
Tyson Baird, PhD, D-ABFT-FT / Chief Toxicologist
Kimberly Youso, MS, D-ABFT-FT / Toxicology Laboratory Manager
Lana Goodson, BA / Criminalistics Laboratory Manager
Sarah Geering, MS / Biology/DNA Laboratory Manager
Introduction
The Regional Forensic Science Center (RFSC) officially opened on December 21, 1995. The Center houses the Sedgwick County Office of the District Coroner (Sedgwick County Coroner) and the Forensic Science Laboratory. The Forensic Science Laboratory are made up of three major units: Criminalistics (Drug Identification, Firearms, and Fire Debris), Biology/DNA, and Toxicology (Antemortem and Postmortem).
The Forensic Science Laboratory is staffed with highly trained and experienced forensic scientists, many of whom have advanced scientific degrees (MS, MSFS, PhD). In 2025, the laboratory staff consisted of 22 scientists and 2 support personnel.
In April 1996, the Forensic Science Laboratory began accepting cases for firearms examinations. Three months later, the Biology Laboratory provided forensic examinations for the identification of biological fluids. The Toxicology Laboratory began producing comprehensive examinations in postmortem toxicology in support of the Sedgwick County Coroner in September of 1996. This was followed by the Forensic Science Laboratories providing forensic drug identification for local and regional law enforcement agencies. In November 1996, fire debris analysis was added to the Criminalistics Unit. In January 1997 the Biology/DNA Laboratory became the first short tandem repeat-deoxynucleic acid (STR-DNA) testing laboratory in the State of Kansas.
In 2003, the Forensic Science Laboratory first became accredited by the American Society of Crime Laboratory Directors/Laboratory Accreditation Board (ASCLD/LAB) under the ASCLD/LAB-Legacy program.
In February 2014, the Forensic Laboratory was granted ASCLD/LAB-International accreditation for Forensic Testing Laboratories in the categories of Controlled Substances, Quantitative Analysis, Antemortem Toxicology, Postmortem Toxicology, DNA-Nuclear, Body Fluid Identification, Fire Debris, Firearms, and Serial Number Restoration. The ASCLD/LAB-International accreditation program evaluates the laboratory’s management system, and technical procedures and practices against criteria set forth in ISO/IEC 17025:2005, and the testing laboratory requirements of the ASCLD/LAB-International Supplemental Requirements.
In 2018 and 2022, the Forensic Science Laboratory completed a full ANAB assessment under the ISO/IEC 17025:2017 and AR3125 standards. The laboratory was the first in the state and among the first in the nation to undergo assessment for these new international accreditation standards. This enhanced accreditation program is based upon the latest set of requirements against which a forensic testing laboratory can be evaluated.
Meeting these accreditation requirements demonstrates the Forensic Laboratory’s commitment to excellence in the services provided to submitting agencies.
Forensic Science Laboratory Service Overview
Sedgwick County vs. Out-of-County Cases
The Regional Forensic Science Center functions as the primary forensic crime laboratory for all Sedgwick County law enforcement agencies and delivers forensic services to numerous additional counties and municipalities across Kansas. Most laboratory casework supports Sedgwick County law enforcement agencies and the Sedgwick County Coroner, with a substantial portion of out-of-county analyses performed in conjunction with the Sedgwick County Coroner’s out-of-county autopsies. The municipalities and counties served in 2025 are listed in Table 1.
In 2025, the Forensic Science Laboratory provided expert testing services and consultations to 50 law enforcement agencies, fire departments, and district coroners from 13 Kansas Coroner Districts from across 20 counties.
| Law Enforcement | Fire Department | County Coroners |
|---|---|---|
|
Bel Aire Police Department |
Sedgwick County Fire Department |
Barber County |
|
Bentley Police Department |
Wichita Fire Department |
Butler County |
|
Bureau of Alcohol, Tobacco, Firearms and Explosives |
|
Cowley County |
|
Cheney Police Department |
|
Ellis County |
|
Clearwater Police Department |
|
Finney County |
|
Colwich Police Department |
|
Gove County |
|
Department of Homeland Security |
|
Greenwood County |
|
Derby Police Department |
|
Harper County |
|
Drug Enforcement Administration |
|
Harvey County |
|
El Dorado Correctional Facility |
|
Kingman County |
|
Ellsworth Correctional Facility |
|
McPherson County |
|
Goddard Police Department |
|
Mitchell County |
|
Goddard USD 265 Police Department |
Pawnee County |
|
|
Haysville Police Department |
|
Phillips County |
|
Hutchinson Correctional Facility |
|
Pratt County |
|
Kansas Highway Patrol |
|
Reno County |
|
Kechi Police Department |
|
Russell County |
|
Kansas Department of Corrections |
|
Sedgwick County |
|
Maize Police Department |
|
Sumner County |
|
Mount Hope Police Department |
|
Wilson County |
|
Mulvane Police Department |
|
|
|
Park City Police Department |
|
|
|
Sedgwick County Sheriff’s Office |
|
|
|
Valley Center Police Department |
|
|
|
Wichita Municipal Court |
|
|
|
Wichita Police Department |
|
|
|
Wichita State University Police Department |
|
|
|
Winfield Correctional Facility |
|
|
Case Submissions
Law enforcement agencies submit criminal cases to the Forensic Laboratory for examination and analysis, and the Sedgwick County Coroner submits postmortem cases to assist in determining the cause and manner of death and for decedent identifications.
A case is established in connection with a criminal or death investigation and is assigned a unique case number at the time of initial submission. Each submission may contain multiple items of evidence associated with that case. For example, a homicide case submitted for Biology/DNA examination and/or analysis may include the victim’s and suspect’s clothing, a weapon, and blood swabs collected from the scene. As an investigation progresses, the submitting agency may provide additional evidence to the laboratory for testing. These are recorded as subsequent submissions and may include additional items for examination and/or analysis. To provide a more comprehensive measure of laboratory services provided, this report presents metrics for new cases submitted, cases submitted, submissions received, and items examined. “New cases submitted” refers to the number of new case numbers generated during the reporting period, while “cases submitted” refers to the number of unique case numbers for which evidence was submitted during the reporting period including any requiring supplemental examination and/or analysis. This approach is necessary because case complexity varies considerably; some cases involve a single submission containing one item, whereas others involve multiple submissions encompassing several items.
During the past several years, the laboratory has experienced increased submissions of sexual assault cases, cases involving emerging designer drugs, and polysubstance drug cases. These case types have also grown more complex to examine and analyze, often involving a greater number of associated items per case. In addition, firearms case submissions have increased compared with prior years.
Figure 1 shows that the laboratory received evidence from 3,188 newly initiated cases in 2021, 2,714 in 2022, 2,429 in 2023, 2,084 in 2024, and 2,205 in 2025, indicating a consistent decline from 2021 through 2024, followed by an increase in 2025.
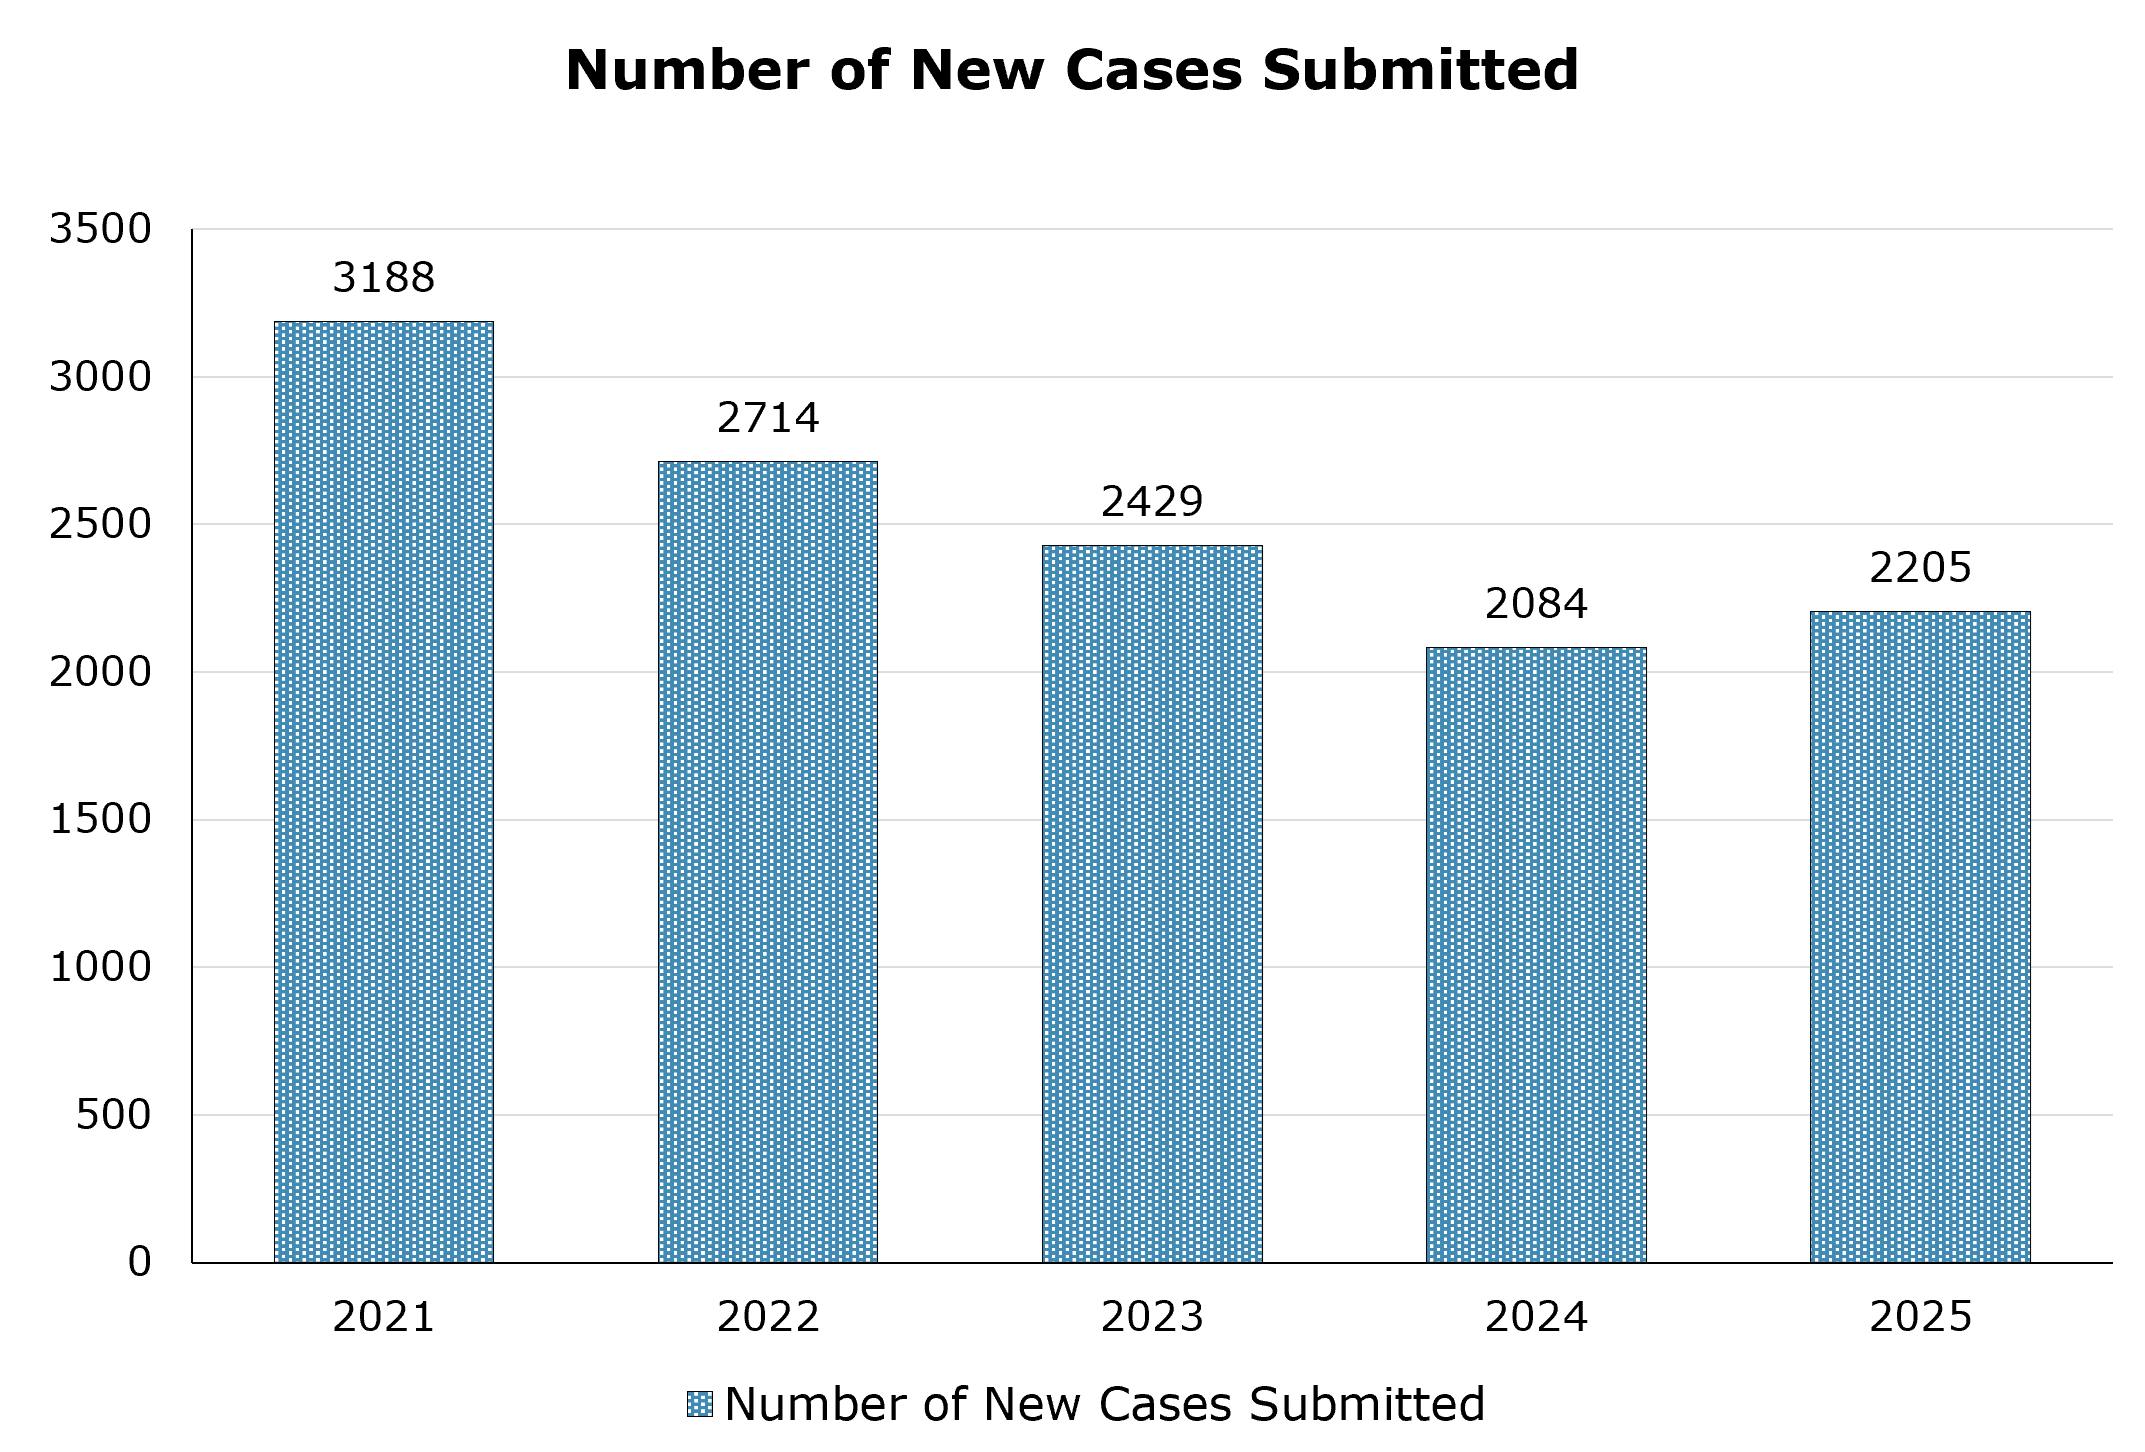
| 2021 | 2022 | 2023 | 2024 | 2025 | |
|---|---|---|---|---|---|
| Number of New Cases | 3188 | 2717 | 2429 | 2084 | 2205 |
Figure 2 illustrates the number of items examined by each Forensic Laboratory section at the Regional Forensic Science Center in 2025. In total, the laboratory examined 9,181 items.
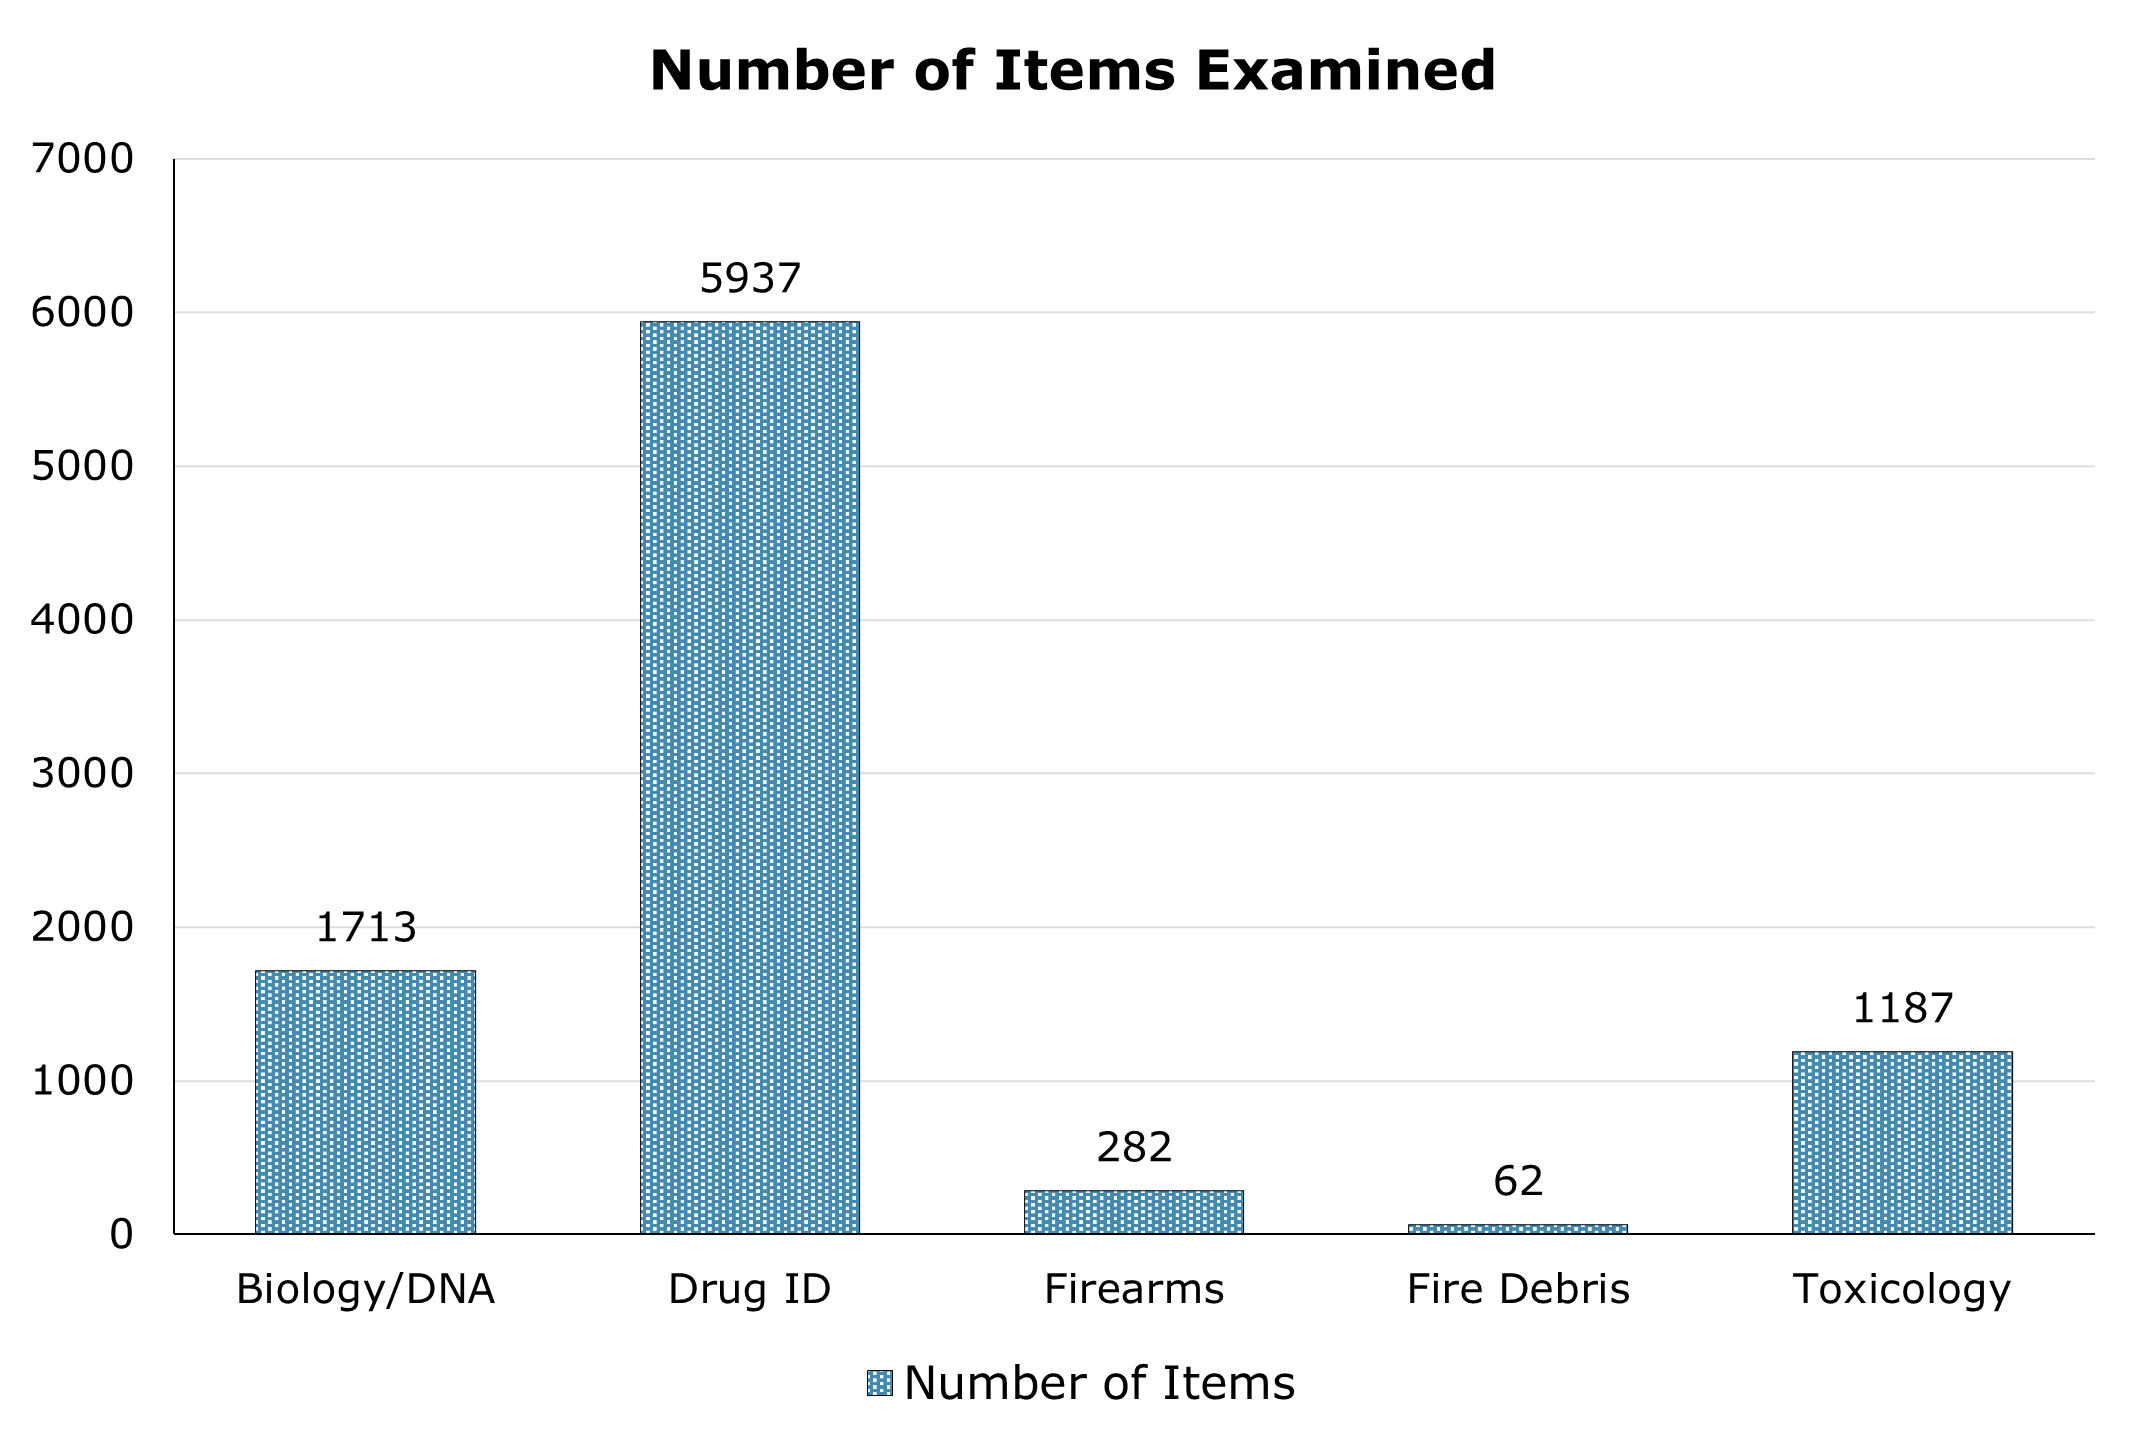
| Biology/DNA | Durg ID | Firearms | Fire Debris | Toxicology | |
|---|---|---|---|---|---|
| Number of Items | 1713 | 5937 | 282 | 62 | 1187 |
Figure 3 illustrates the combined laboratory section-level total of cases first submitted to the Forensic Laboratory each year, with each case counted once for every laboratory section to which it was submitted. The combined laboratory section-level total of new cases was 3,322 in 2021; 2,844 in 2022; 2,554 in 2023, 2,211 in 2024, and 2,347 in 2025, indicating a consistent decline from 2021 through 2024, followed by an increase in 2025.
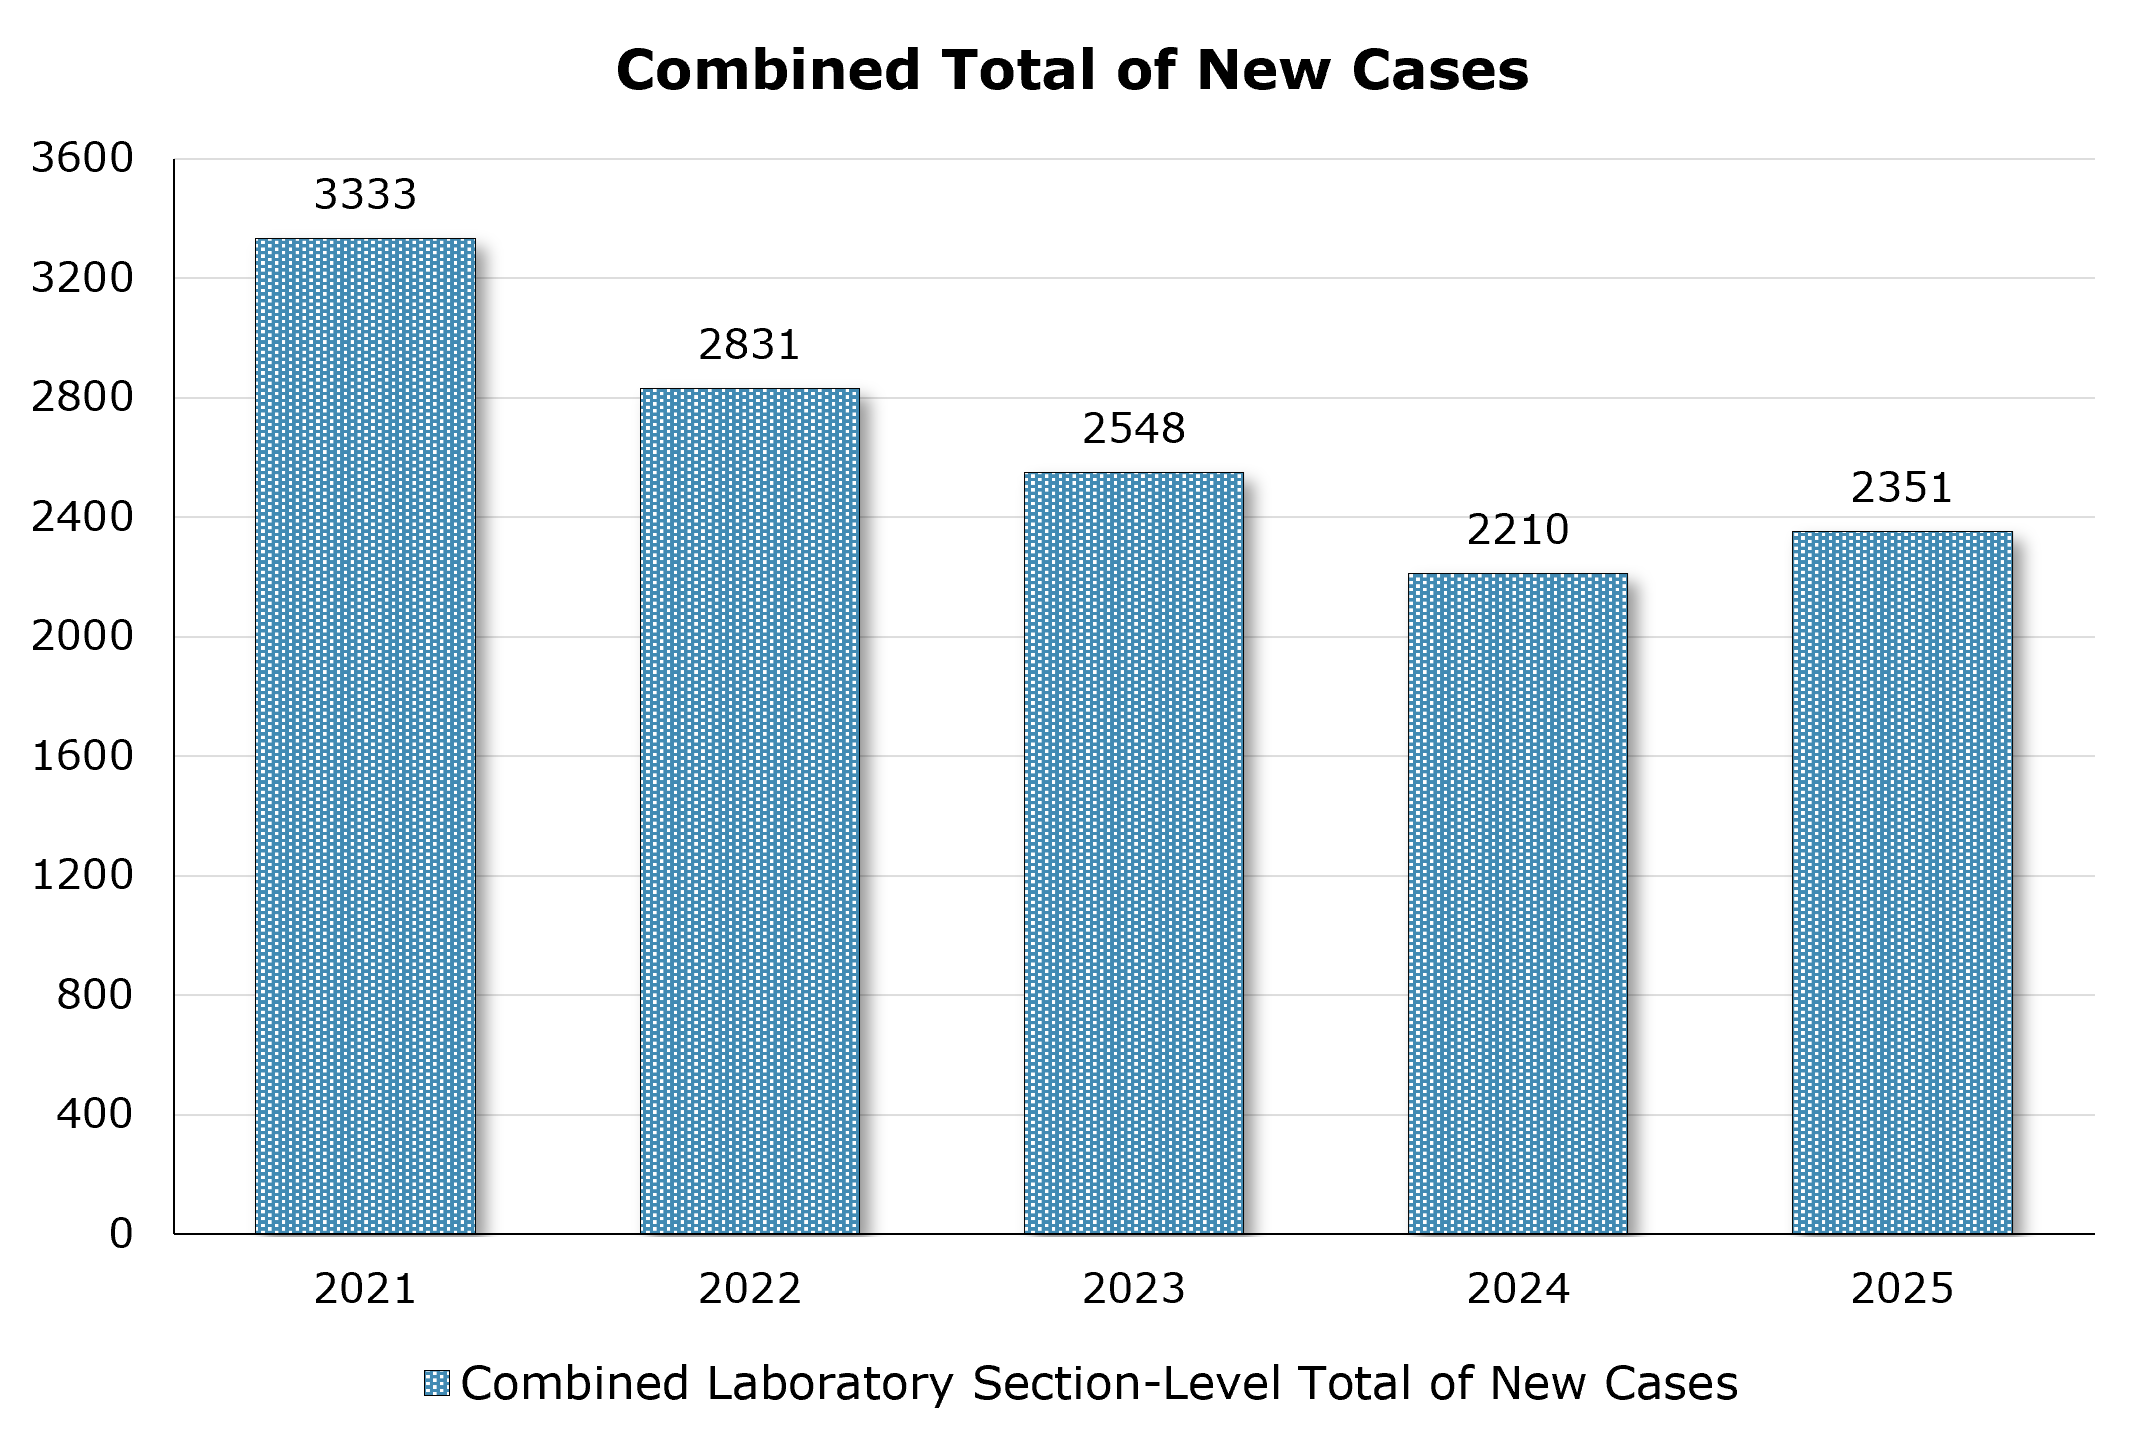
| 2021 | 2022 | 2023 | 2024 | 2025 | |
|---|---|---|---|---|---|
| Combined Total | 3333 | 2831 | 2548 | 2210 | 2351 |
Table 2 shows the distribution of newly submitted cases across laboratory sections as follows: Biology/DNA at 12.48 percent, Drug Identification at 36.17 percent, Firearms at 5.62 percent, Fire Debris at 1.11 percent, Toxicology Antemortem at 10.65 percent, and Toxicology Postmortem at 33.96 percent.
| Laboratory Section | Percent of New Case Submissions |
|---|---|
| Biology/DNA | 12.48 |
| Drug Identification | 36.17 |
| Firearms | 5.62 |
| Fire Debris | 1.11 |
| Toxicology Antemortem | 10.65 |
| Toxicology Postmortem | 33.96 |
Table 3 presents a listing of the agencies that submitted evidence to the laboratory division for forensic analysis and the number of new cases that were submitted by each agency in 2025, the total of which is 2,209. The Sedgwick County Coroner submits evidence for analysis on behalf of other County Coroners in support of the regional autopsy service. Out-of-county agencies that submit evidence for analysis are subject to a fee schedule set forth by the Sedgwick County Board of County Commissioners.
| Agency | Number of New Cases |
|---|---|
|
Sedgwick County Coroner |
799 |
|
Wichita Police Department |
693 |
|
Sedgwick County Sheriff’s Office |
395 |
|
Kansas Highway Patrol |
93 |
|
Derby Police Department |
45 |
|
Park City Police Department |
32 |
|
Haysville Police Department |
22 |
|
Clearwater Police Department |
18 |
|
Wichita Fire Department |
18 |
|
Goddard Police Department |
13 |
|
Mulvane Police Department |
10 |
|
Bureau of Alcohol, Tobacco, Firearms and Explosives |
9 |
|
Hutchinson Correctional Facility |
9 |
|
Maize Police Department |
8 |
|
Wichita Municipal Court |
8 |
|
Bel Aire Police Department |
7 |
|
Kechi Police Department |
7 |
|
Bentley Police Department |
4 |
|
Goddard USD 265 Police Department |
4 |
|
Sedgwick County Fire Department |
4 |
|
Cheney Police Department |
3 |
|
Colwich Police Department |
1 |
|
Department of Homeland Security |
1 |
|
El Dorado Correctional Facility |
1 |
|
Ellsworth Correctional Facility |
1 |
|
Mount Hope Police Department |
1 |
|
Valley Center Police Department |
1 |
|
Wichita State University Police Department |
1 |
|
Winfield Correctional Facility |
1 |
The number of new cases accounts for most submissions to the laboratory; however, some cases require subsequent submissions throughout time to assist in answering the forensic questions of the case. The number of submissions in 2025 was 2,687, the combined total of all new and supplemental cases submitted in 2025 was 2,404.
Some cases involved subsequent submissions for additional examination and/or analysis, while others required examination and/or analysis by more than one laboratory section. As such, considering the number of submissions is also useful for assessing services provided.
Table 4 summarizes the percentage of total case submissions attributed to each laboratory section, with cases counted in each section to which they were submitted. Toxicology Postmortem accounted for the highest proportion of submissions at 33.42 percent, followed by Drug Identification at 33.35 percent, Biology/DNA at 16.49 percent, Toxicology Antemortem at 9.42 percent, Firearms at 6.36 percent, and Fire Debris at 0.97 percent.
| Laboratory Section | Percent of Submissions |
|---|---|
| Biology/DNA | 16.49 |
| Drug Identification | 33.35 |
| Firearms | 6.36 |
| Fire Debris | 0.97 |
| Toxicology Antemortem | 9.42 |
| Toxicology Postmortem | 33.42 |
Cases Completed
Cases completed every year include cases that are submitted for the first time that year, backlogged cases from previous years, and cases that were originally submitted in previous years but have additional examinations requested.
Figure 4 shows the number of cases completed by the Forensic Laboratory each year. Overall, completed case volume remained relatively stable from 2021 through 2025. Following a decline from 2,902 cases completed in 2021 to 2,498 in 2022, annual output varied only slightly, with 2631 cases completed in 2023, 2,530 cases completed in 2024 and 2,579 in 2025. These results suggest that case completion levels were largely consistent from 2022 through 2025.
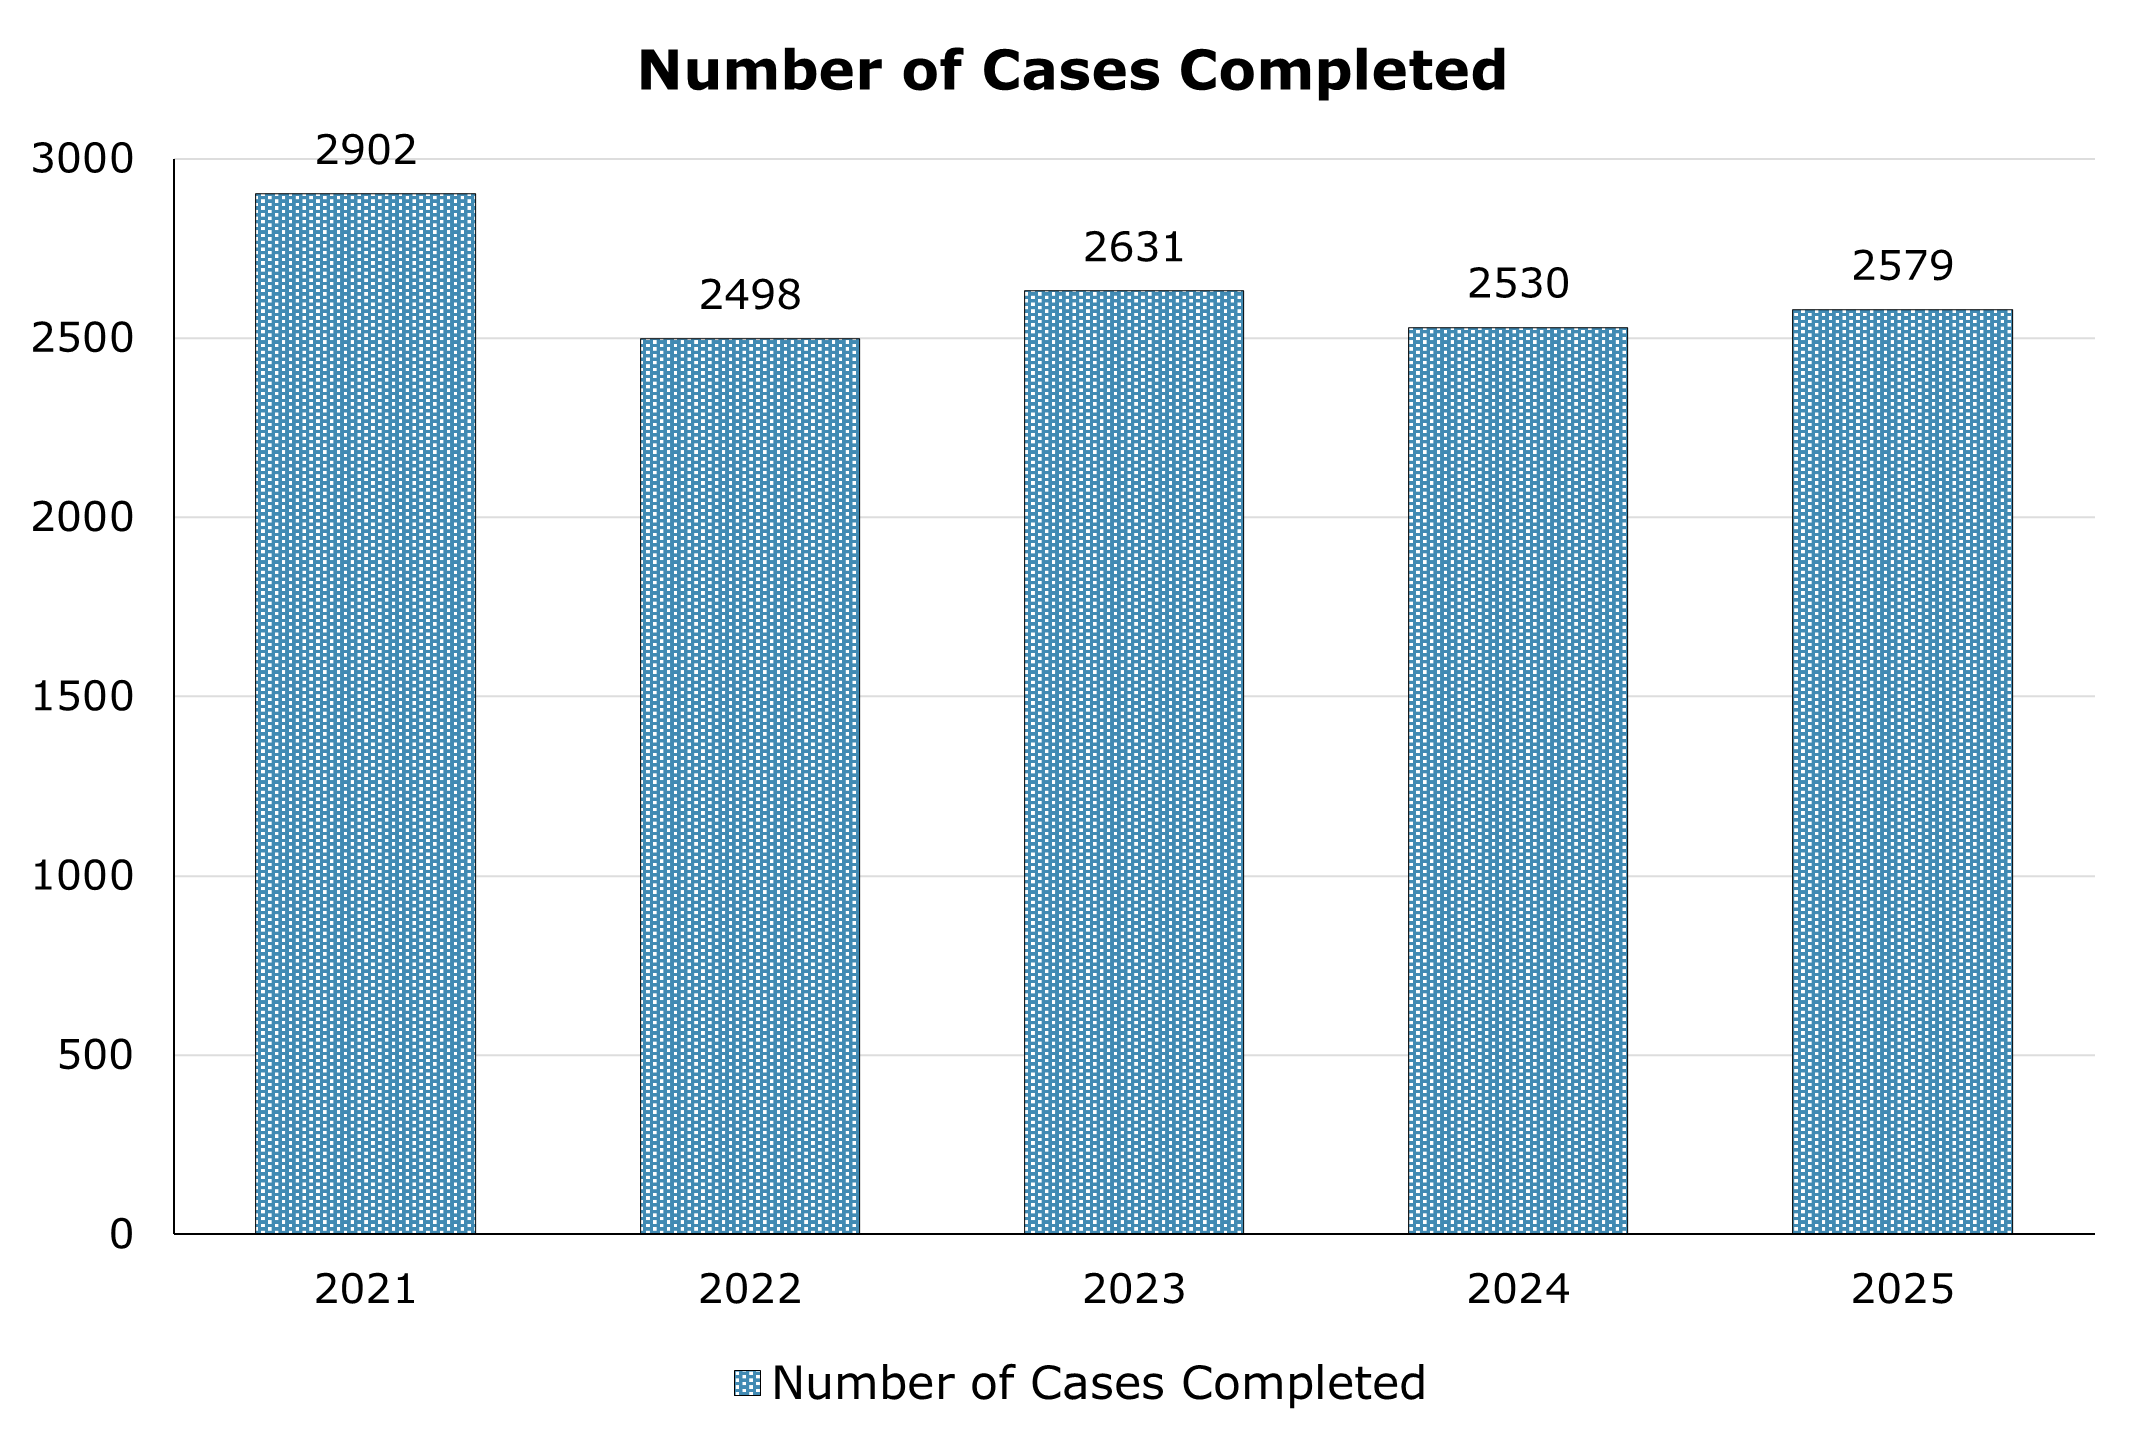
| 2021 | 2022 | 2023 | 2024 | 2025 | |
|---|---|---|---|---|---|
| Cases Completed | 2902 | 2498 | 2631 | 2530 | 2579 |
Case Turnaround Time
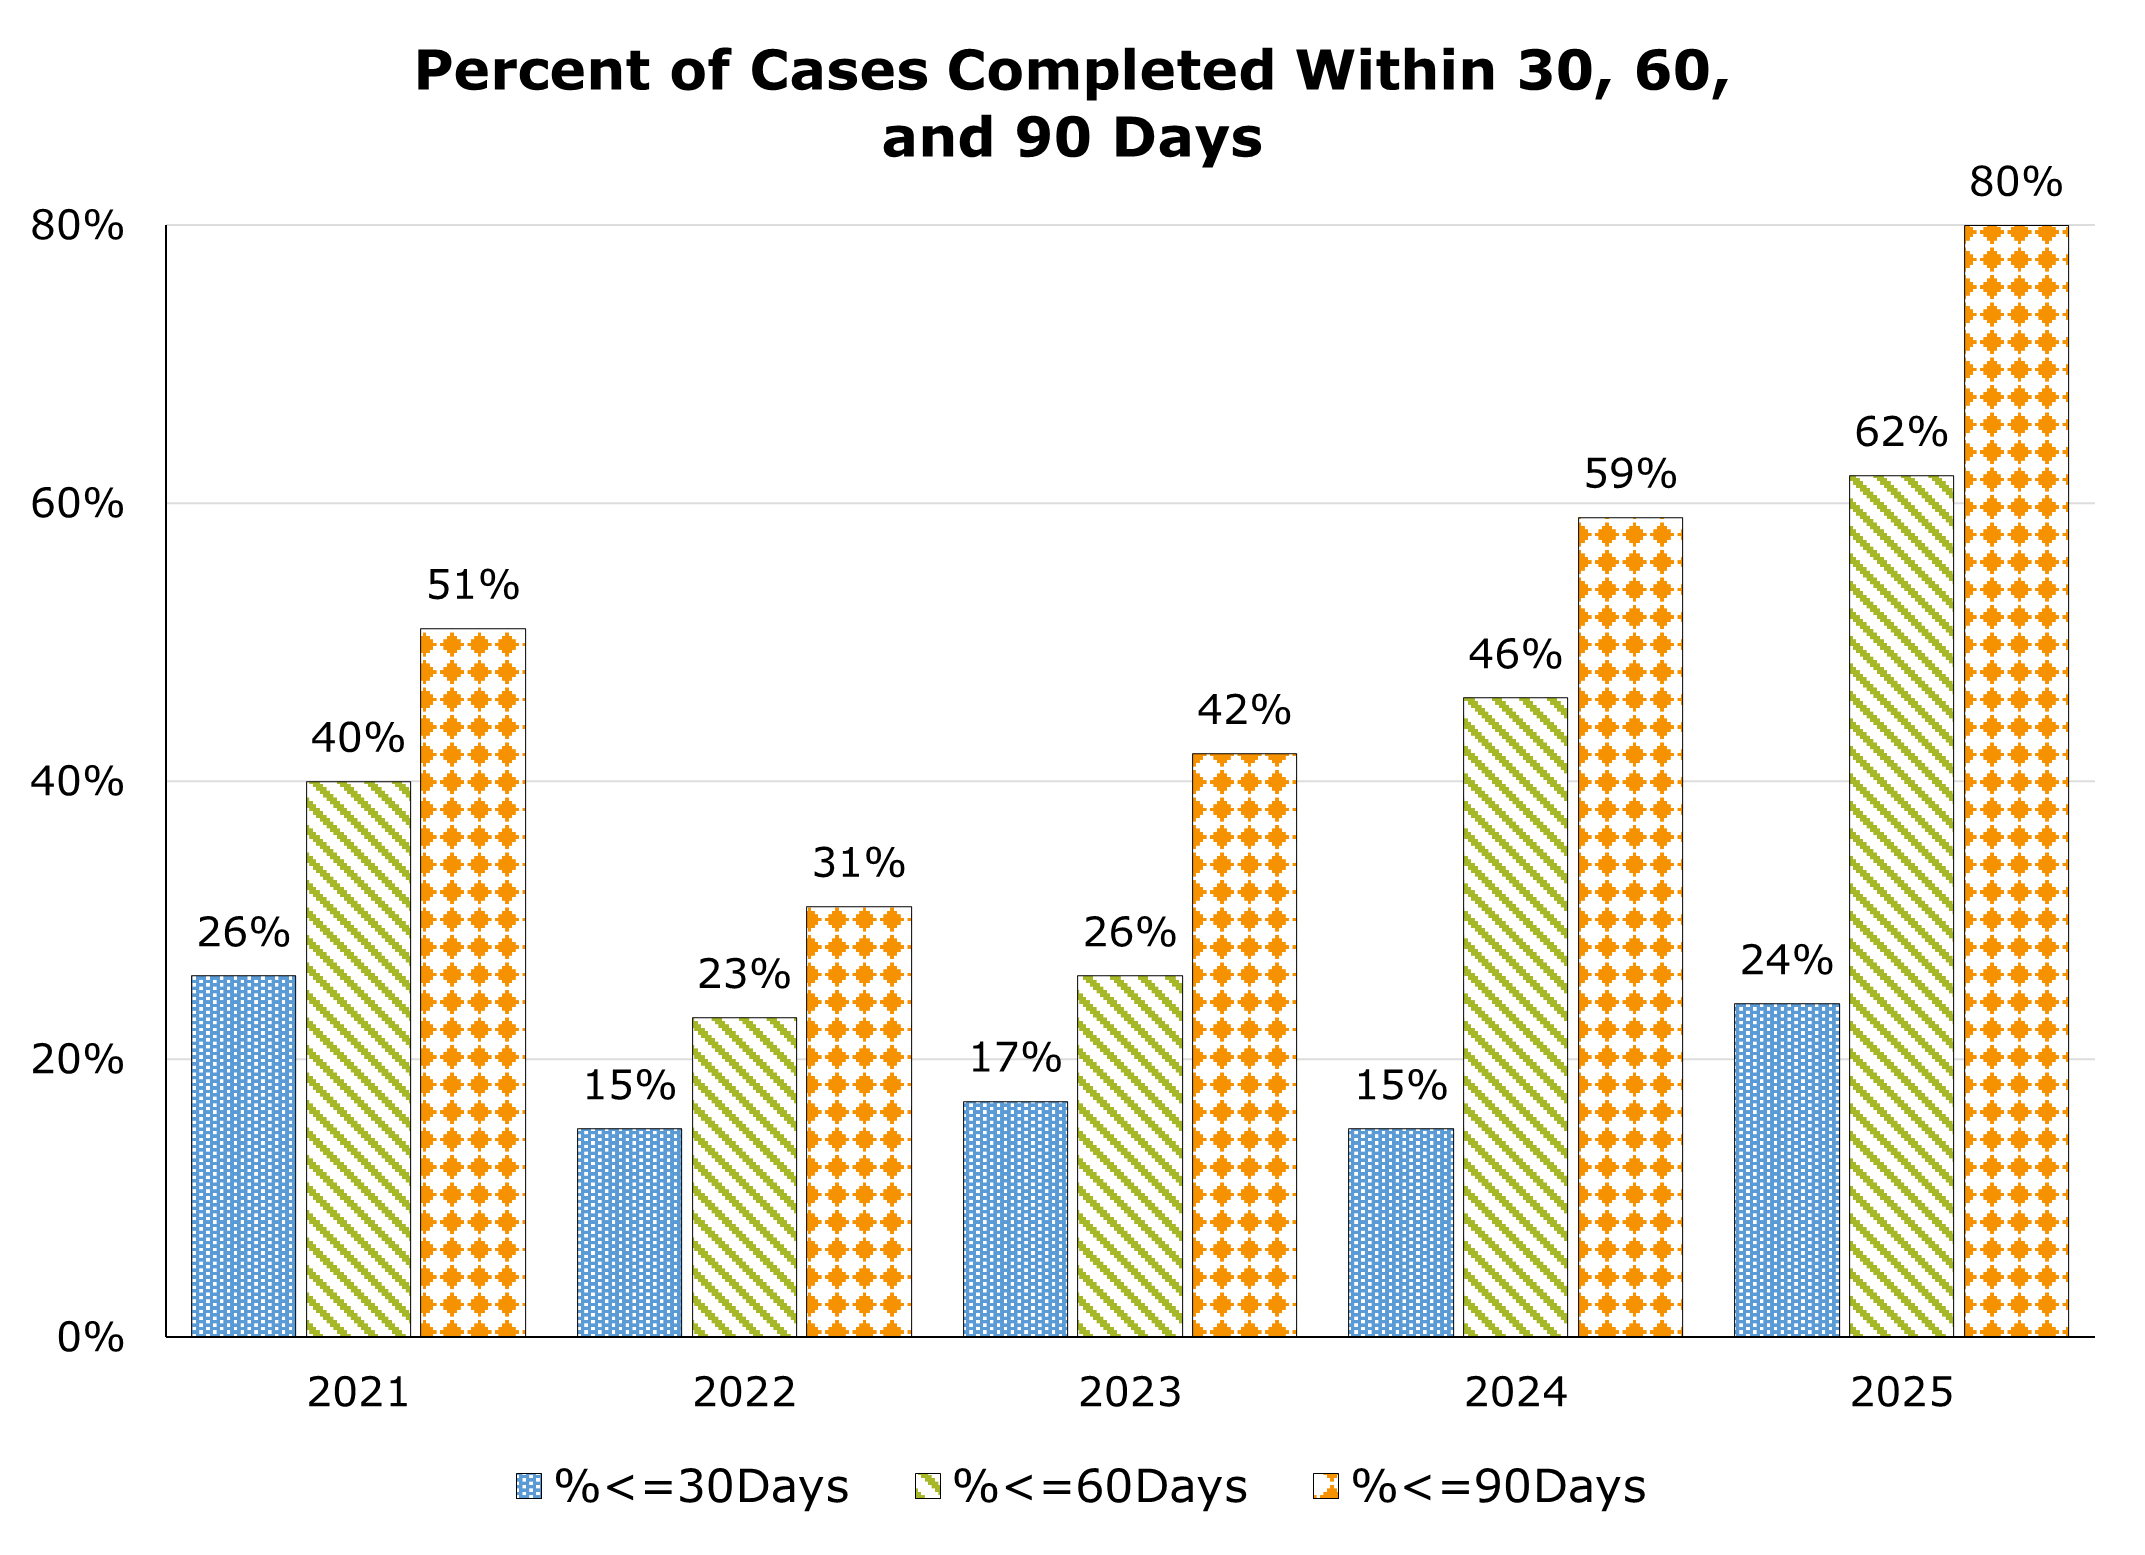
Case turnaround time is a key quantitative measure of Forensic Laboratory operational performance. The laboratory’s internal goal is to complete 90 percent of cases within 90 days. As shown in Figure 5, the percentage of cases completed within 90 days of submission was 51 percent in 2021, declined to 31 percent in 2022, increased to 42 percent in 2023, rose to 59 percent in 2024, and reached 80 percent in 2025. This trend is consistent with the 30-day and 60-day completion metrics, which show similar year-to-year variation.
| 2021 | 2022 | 2023 | 2024 | 2025 | |
|---|---|---|---|---|---|
| Percent less than or equal to 30 Days | 26 | 15 | 17 | 15 | 24 |
| Percent less than or equal to 60 Days | 40 | 23 | 26 | 48 | 62 |
| Percent less than or equal to 90 Days | 51 | 31 | 42 | 59 | 80 |
Backlog
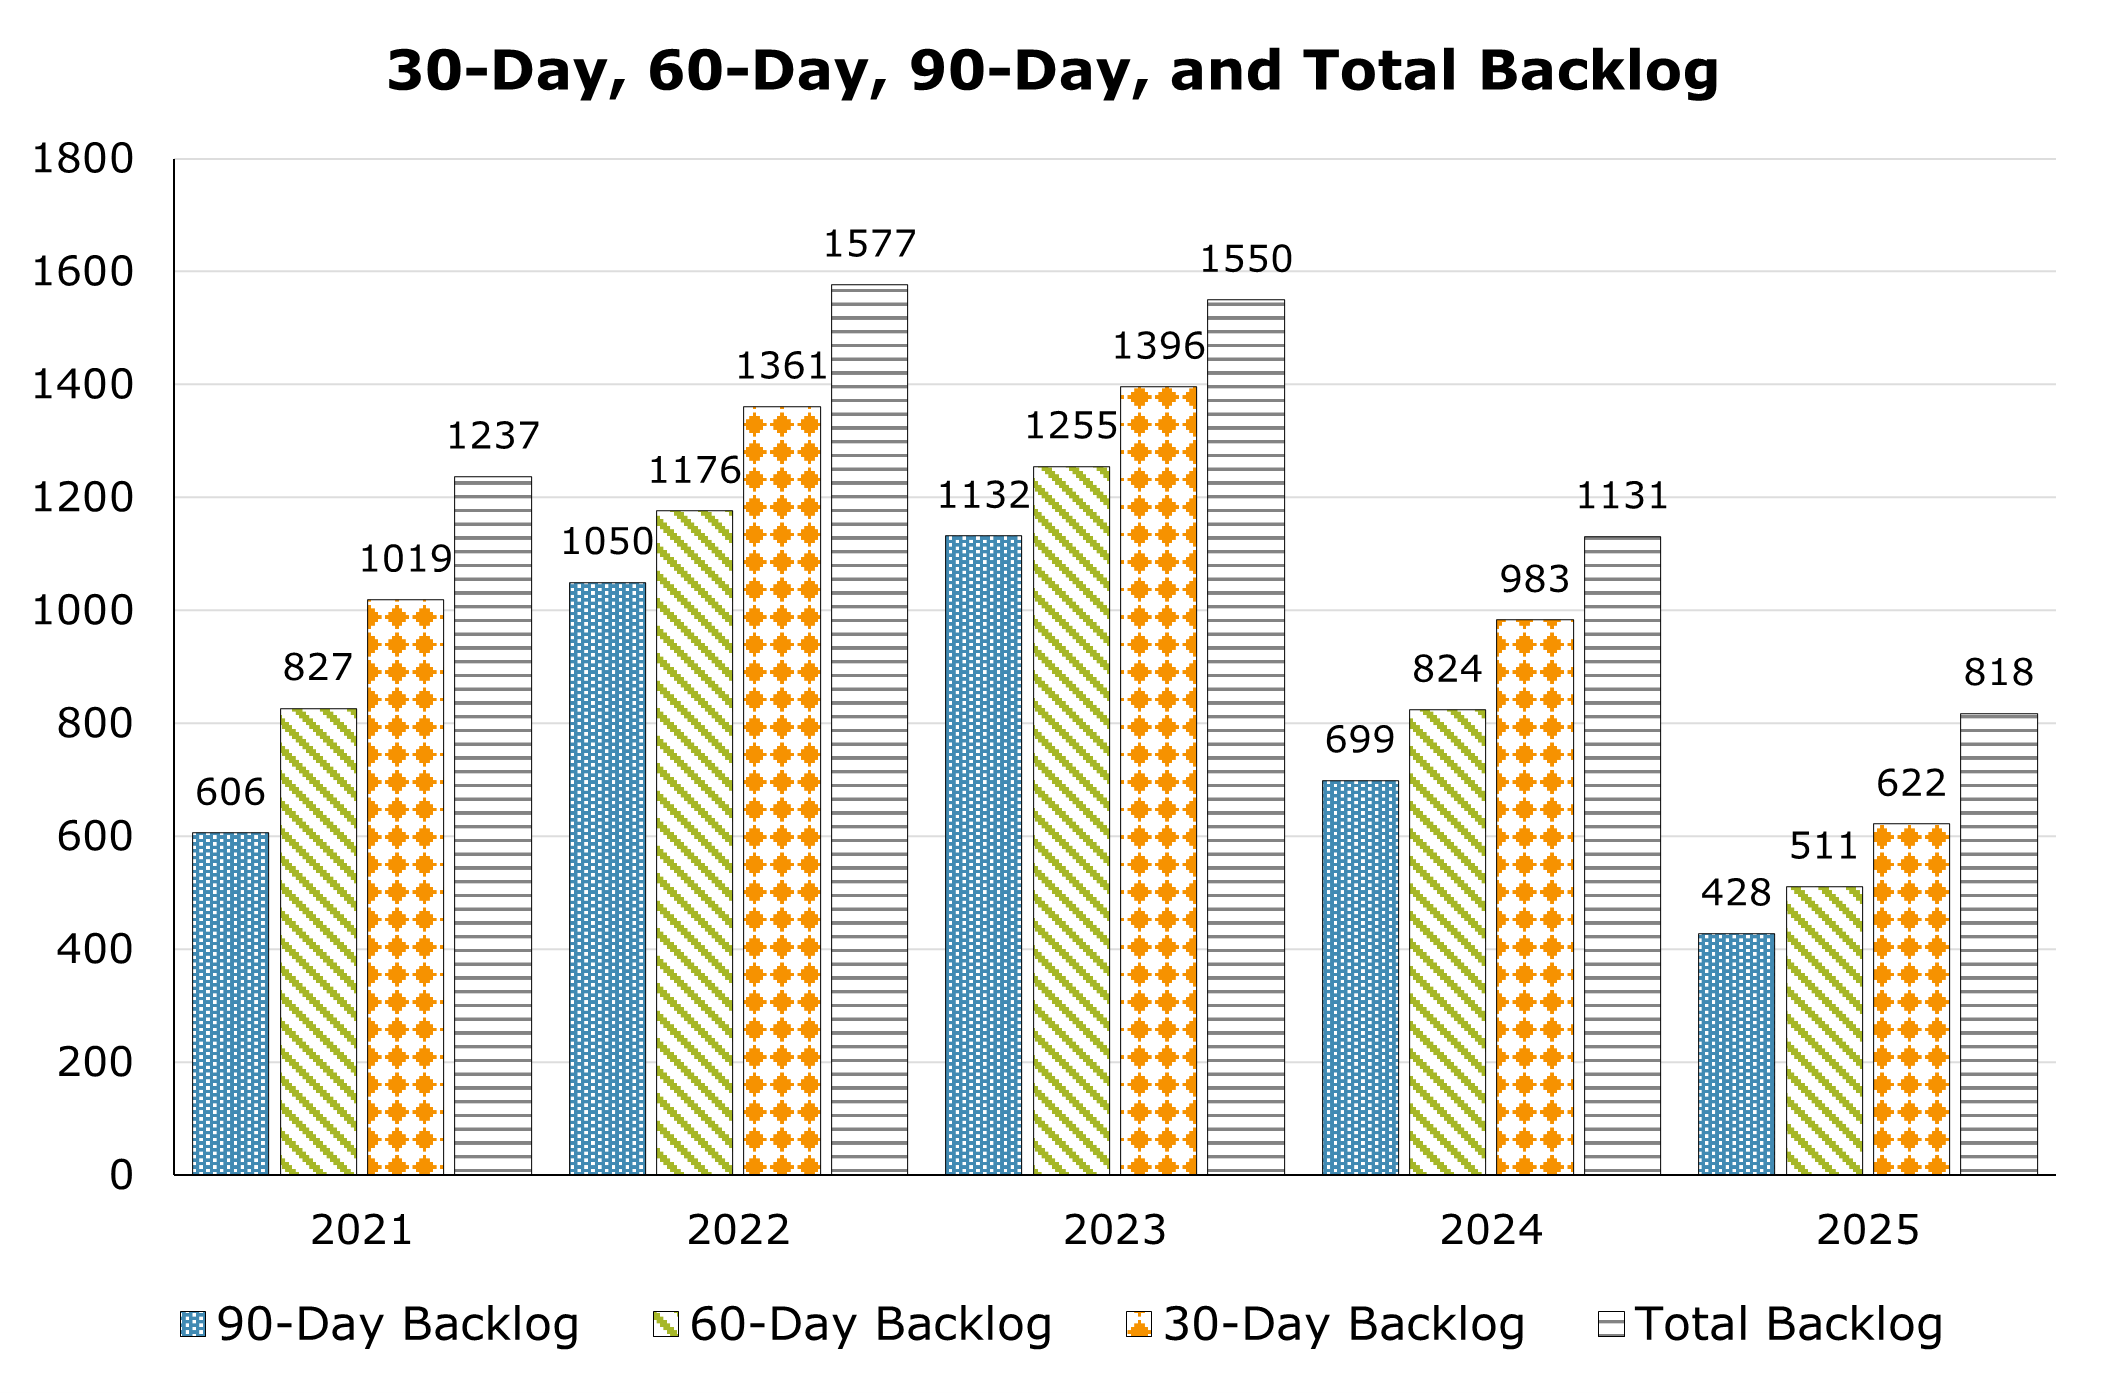
As shown in Figure 6, as of December 31, 2025, the laboratory reported a 90-day backlog of 428 cases, a 60-day backlog of 511 cases, a 30-day backlog of 622 cases, and a total backlog of 818 cases. These figures reflect a continued reduction in outstanding casework compared with 2021 through 2024 and represent the lowest backlog levels recorded during this period. For context, the highest total backlog occurred in 2022 at 1,577 cases, while the second-lowest total backlog was reported in 2024 at 1,131 cases.
| 2021 | 2022 | 2023 | 2024 | 2025 | |
|---|---|---|---|---|---|
| 90-Day Backlog | 606 | 1050 | 1132 | 699 | 428 |
| 60-Day Backlog | 827 | 1176 | 1255 | 824 | 511 |
| 30-Day Backlog | 1019 | 1361 | 1396 | 983 | 622 |
| Total Backlog | 1237 | 1577 | 1550 | 1131 | 818 |
Biology/DNA
The Biology/DNA Laboratory examines evidence from a wide range of case types, including sexual assaults, homicides, property crimes, assaults, and forensic identifications involving unidentified bodies or skeletal remains.
The laboratory screens evidence for the presence of biological material, including blood, semen, and saliva. For DNA analysis, the laboratory develops short tandem repeat (STR) profiles from evidentiary items collected from crime scenes. These profiles may then be compared with reference standards obtained from individuals believed to be associated with the case, such as victims, suspects, or other known individuals. Based on this comparison, conclusions are reached regarding whether the reference standard profiles are consistent with or excluded from the crime scene profiles.
The nature and condition of forensic samples collected at crime scenes can vary substantially. Under optimal conditions, such as with fresh bloodstains, high-quality single-source DNA profiles may be obtained. In other instances, samples may contain biological material from multiple individuals or may have been exposed to environmental conditions that result in low-level and/or degraded DNA. These factors can affect the laboratory’s ability to develop a profile suitable for comparison. When a profile is suitable for comparison, analysts may perform statistical analysis to quantify the significance of an association between a reference sample and a crime scene exhibit and to clearly convey the strength of that association.
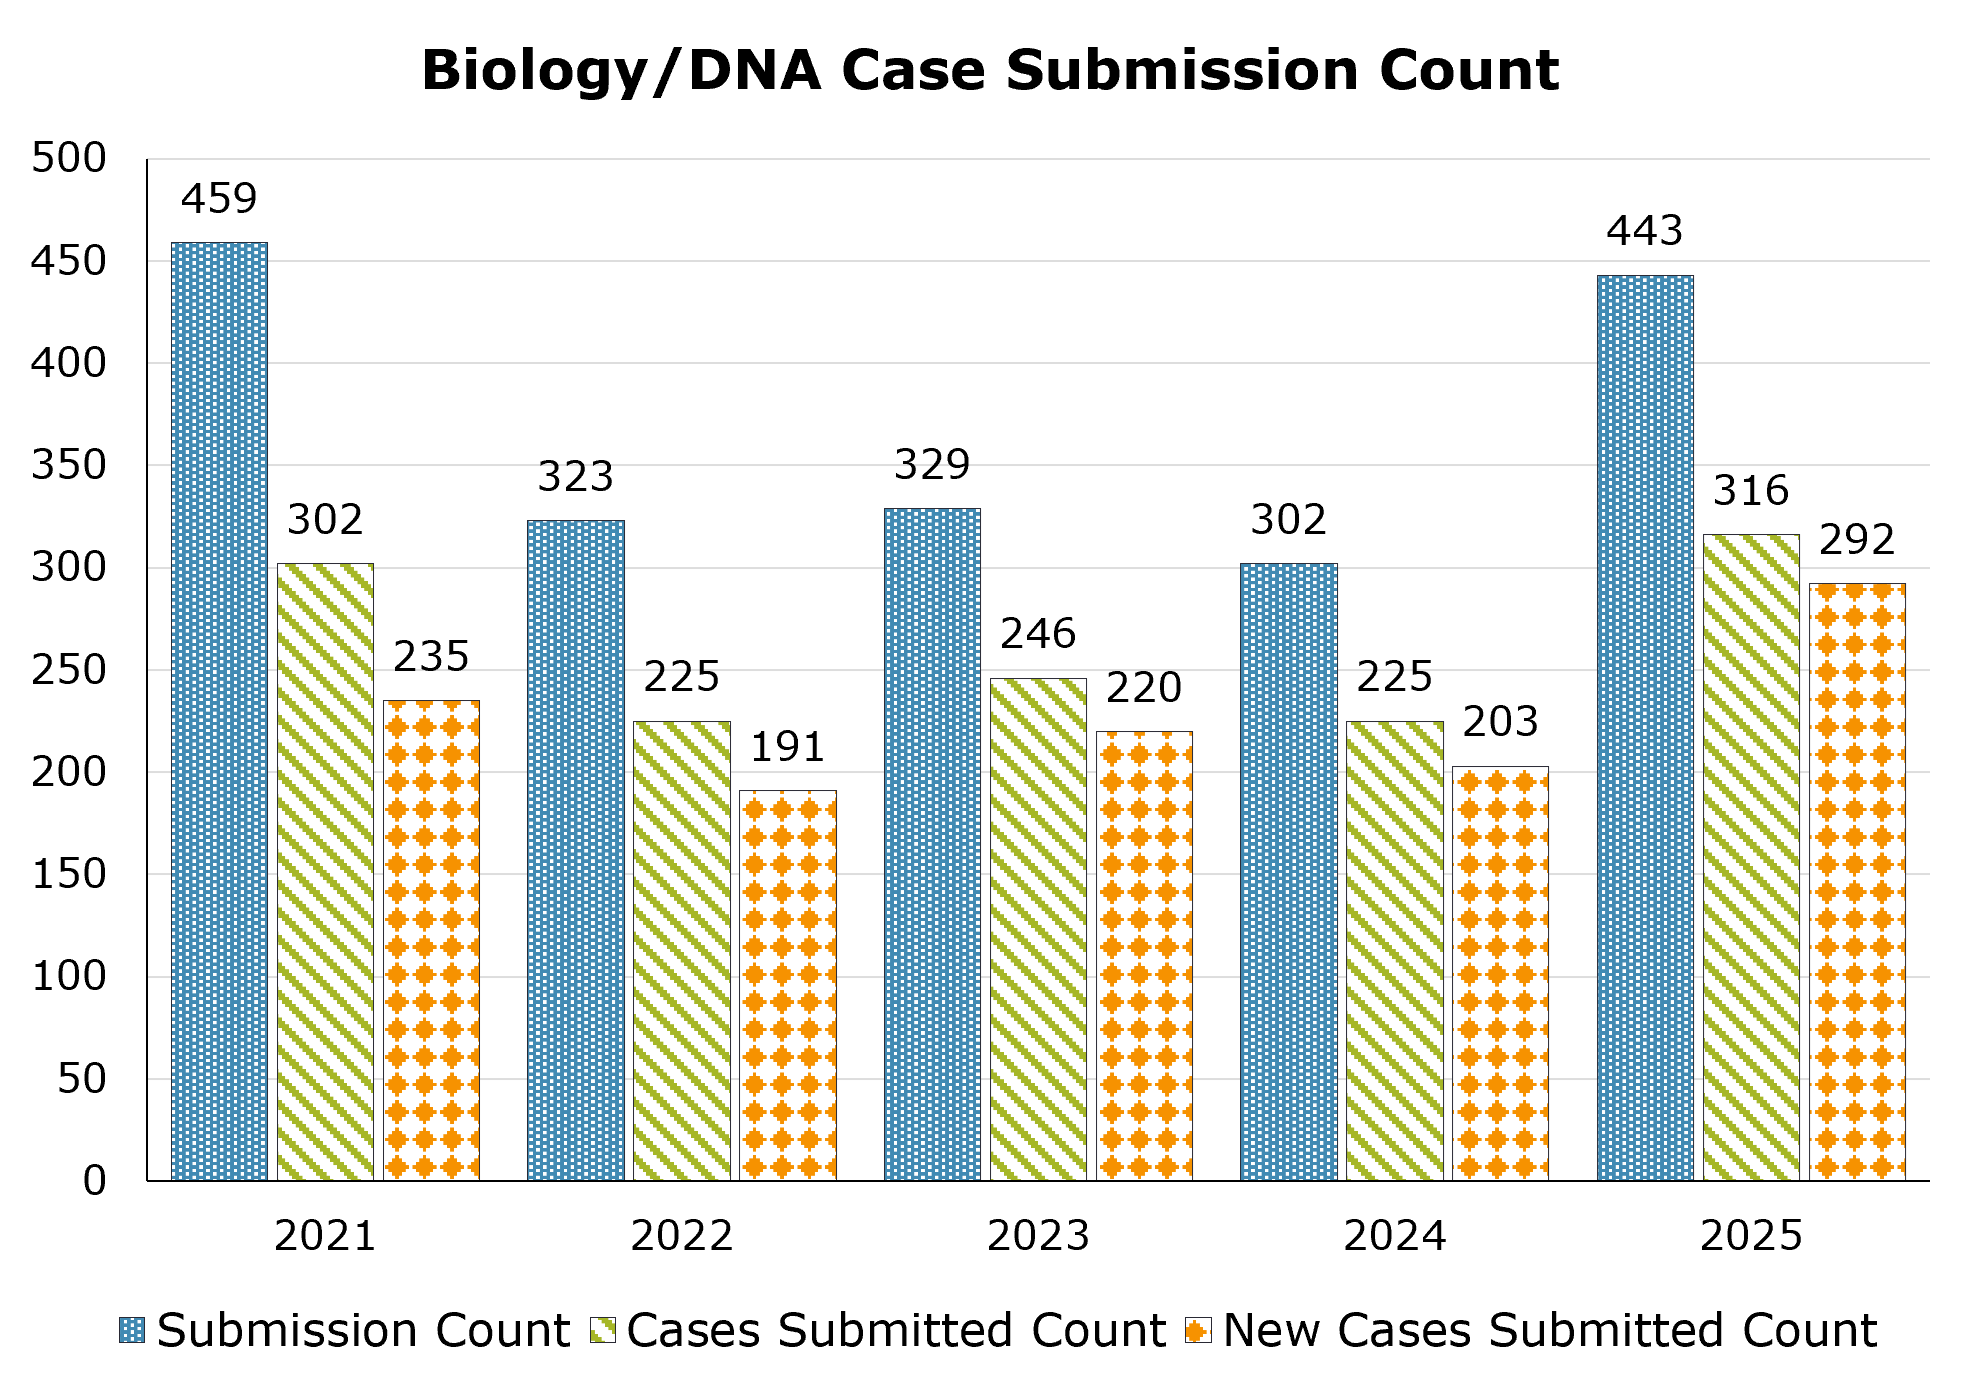
Figure 7 presents three related workload measures for the Biology/DNA Laboratory between 2021 and 2025: the submission count, representing the number of evidence submissions; the cases submitted count, reflecting total unique cases received – including new and previously submitted cases; and the new cases submitted count, indicating first-time case submissions that generate new laboratory case records. In 2025, the laboratory recorded 443 submissions, 316 cases submitted, and 292 new cases submitted. These figures reflect an increase from 2022 through 2024 and are generally consistent with 2021 levels. Compared with 2021, both cases submitted and new cases submitted were higher in 2025, while the total submission count was slightly lower.
| 2021 | 2022 | 2023 | 2024 | 2025 | |
|---|---|---|---|---|---|
| Submission Count | 459 | 323 | 329 | 302 | 443 |
| Cases Submitted Count | 302 | 225 | 246 | 225 | 316 |
| New Cases Submitted Count | 235 | 191 | 220 | 203 | 292 |
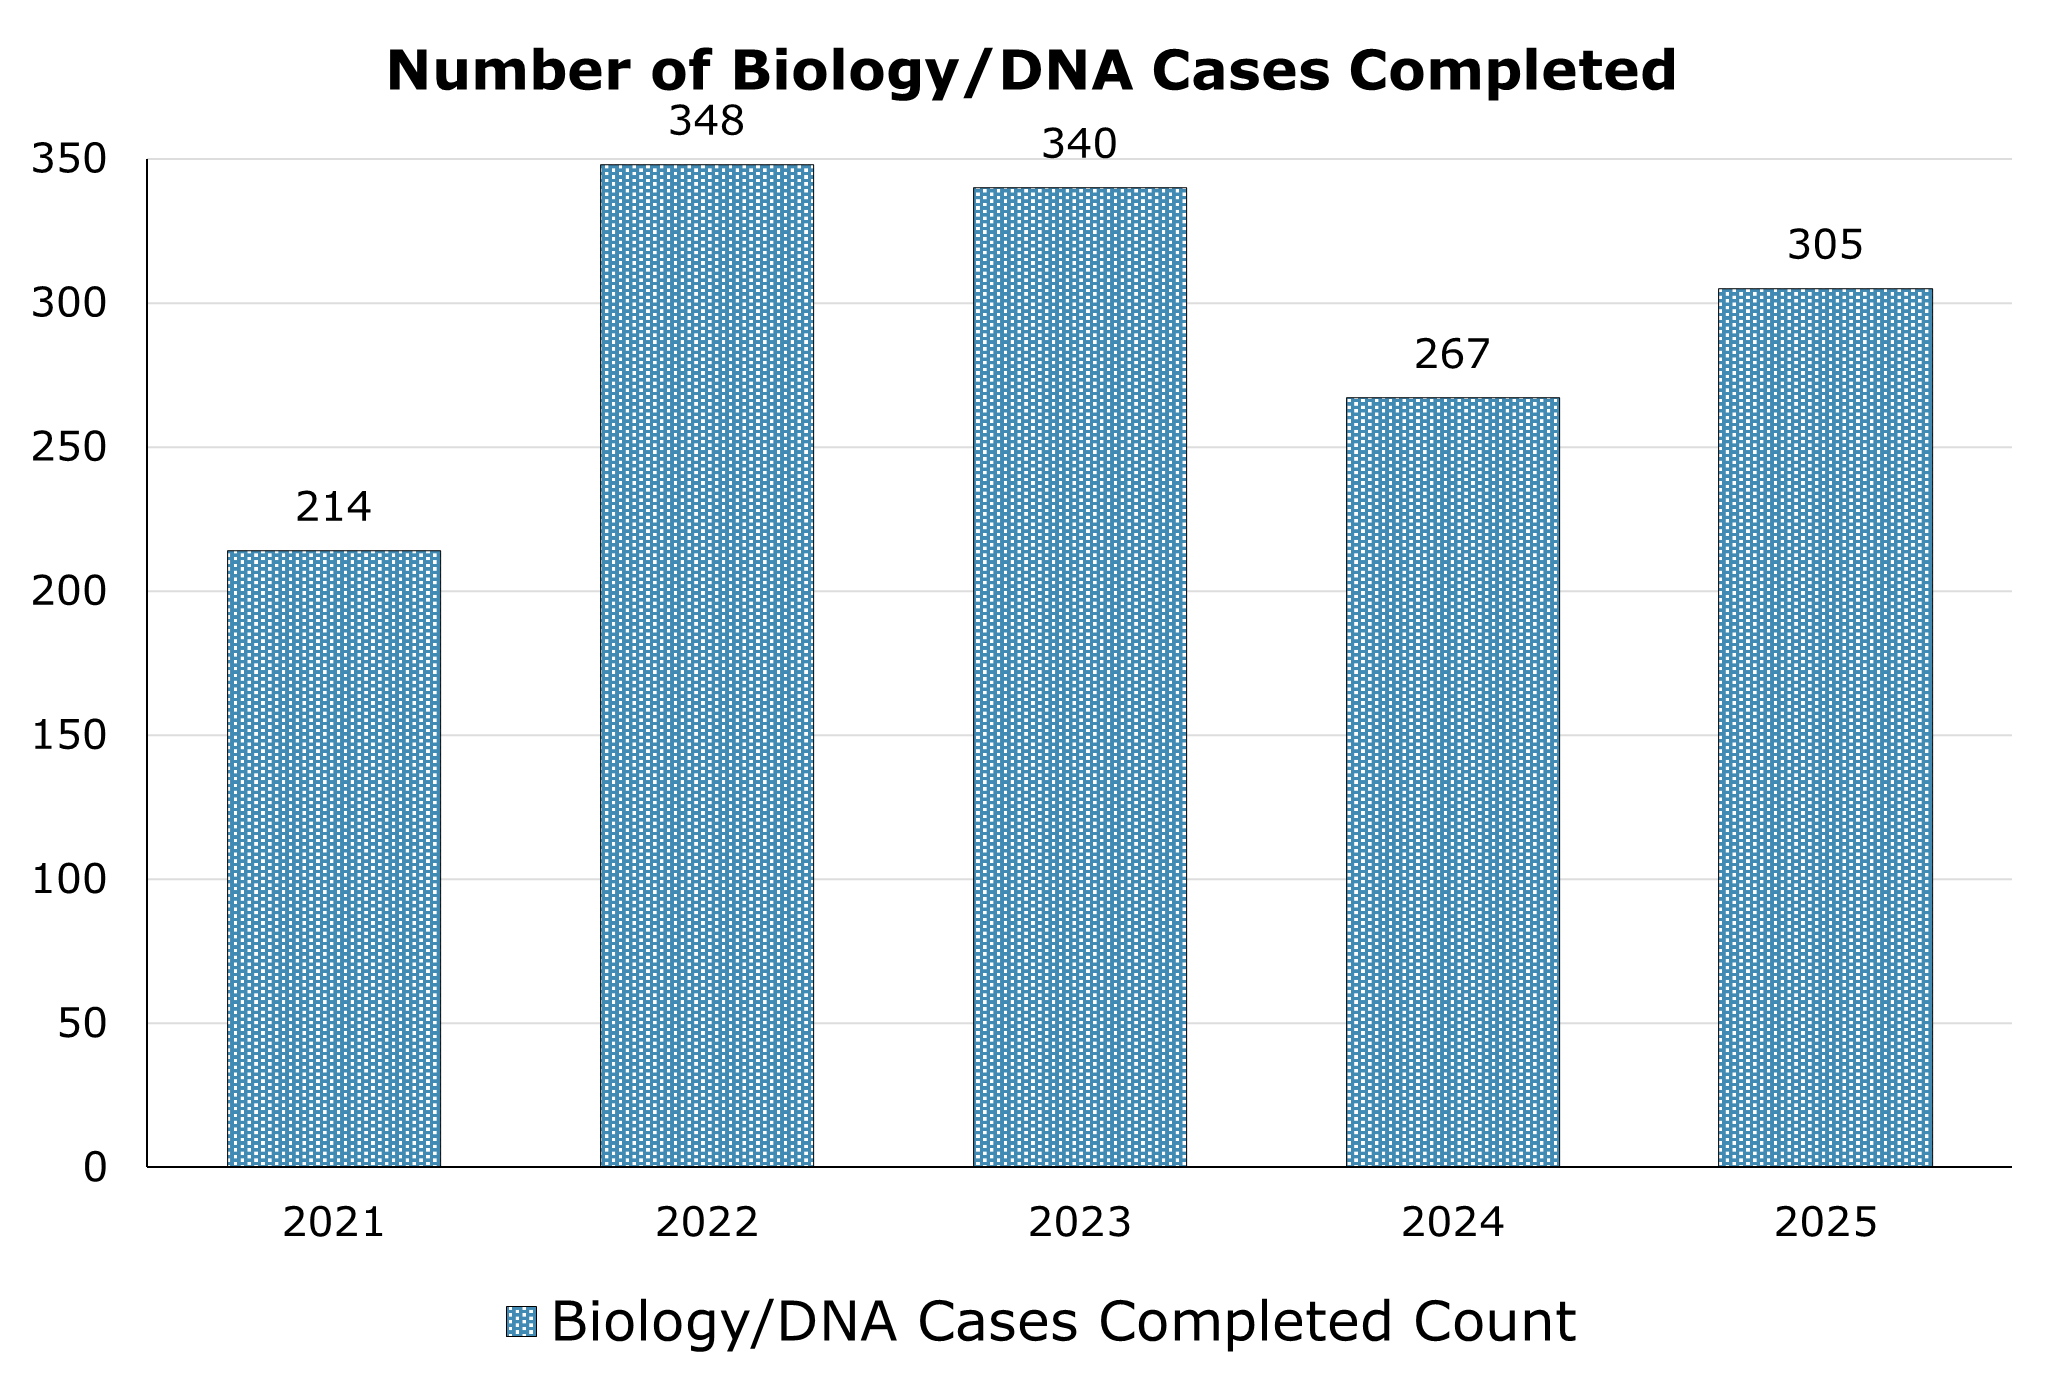
Figure 8 presents the number of cases completed by the Biology/DNA Laboratory from 2021 through 2025. Case completions varied from year-to-year during this period. The laboratory completed 214 cases in 2021, followed by a substantial increase to 348 in 2022. Output remained relatively stable in 2023 at 340 cases, declined to 267 in 2024, and then increased to 305 in 2025.
| 2021 | 2022 | 2023 | 2024 | 2025 | |
|---|---|---|---|---|---|
| Biology/DNA Cases Completed | 214 | 348 | 340 | 267 | 305 |
Table 5 illustrates the number of new cases submitted with violation types categorized as either sex crimes, homicides, other violent crimes, property crimes, and identifications. While cases may have multiple violations that overlap between these categories, the table does provide information about the overall number of the categorized case-types the laboratory examined and/or analyzed.
For crimes against persons, sex crime cases were the most common case type submitted for examination. Property crimes continue to have a high likelihood of resulting in a profile suitable for CODIS entry. Given that these crimes have a high recidivism rate they have an exceptional solvability factor when crime scene profiles are searched against the database. In support of the Sedgwick County Coroner, the laboratory identified 13 human decedents through DNA analysis.
| Case Type | Number of Cases |
|---|---|
| Sex Crimes | 134 |
| Homicides | 27 |
| Other Violent Crimes | 42 |
| Property Crimes | 63 |
| Identifications | 13 |
CODIS
The Combined DNA Index System (CODIS) is database software used to compare DNA profiles within and between crime laboratories throughout the nation. In 2007 Kansas became an all-arrestee state, meaning that law enforcement collects DNA samples for any person arrested for qualifying offenses. DNA profiles generated from an arrestee/offender are entered into the state database in Topeka, KS and are available to be searched against the unknown profiles the Biology/DNA laboratory enters into the Local DNA Index System (LDIS). In late 2009, the DNA Laboratory adopted new procedures for the release of investigative lead information to include formal written and reviewed notifications for database associations.
Over the years, the increased number of associations identified through CODIS resulted in an increase in reports generated, as well as an increase in the number of known samples processed to confirm these additional CODIS hits. The number of CODIS entries, associated hits generated, and oversight of this database entails a large amount of scientist time. Samples compared as a function of database management are not reflected in the number of cases submitted or accounted for as a separate “case type” in the figures describing case submissions.
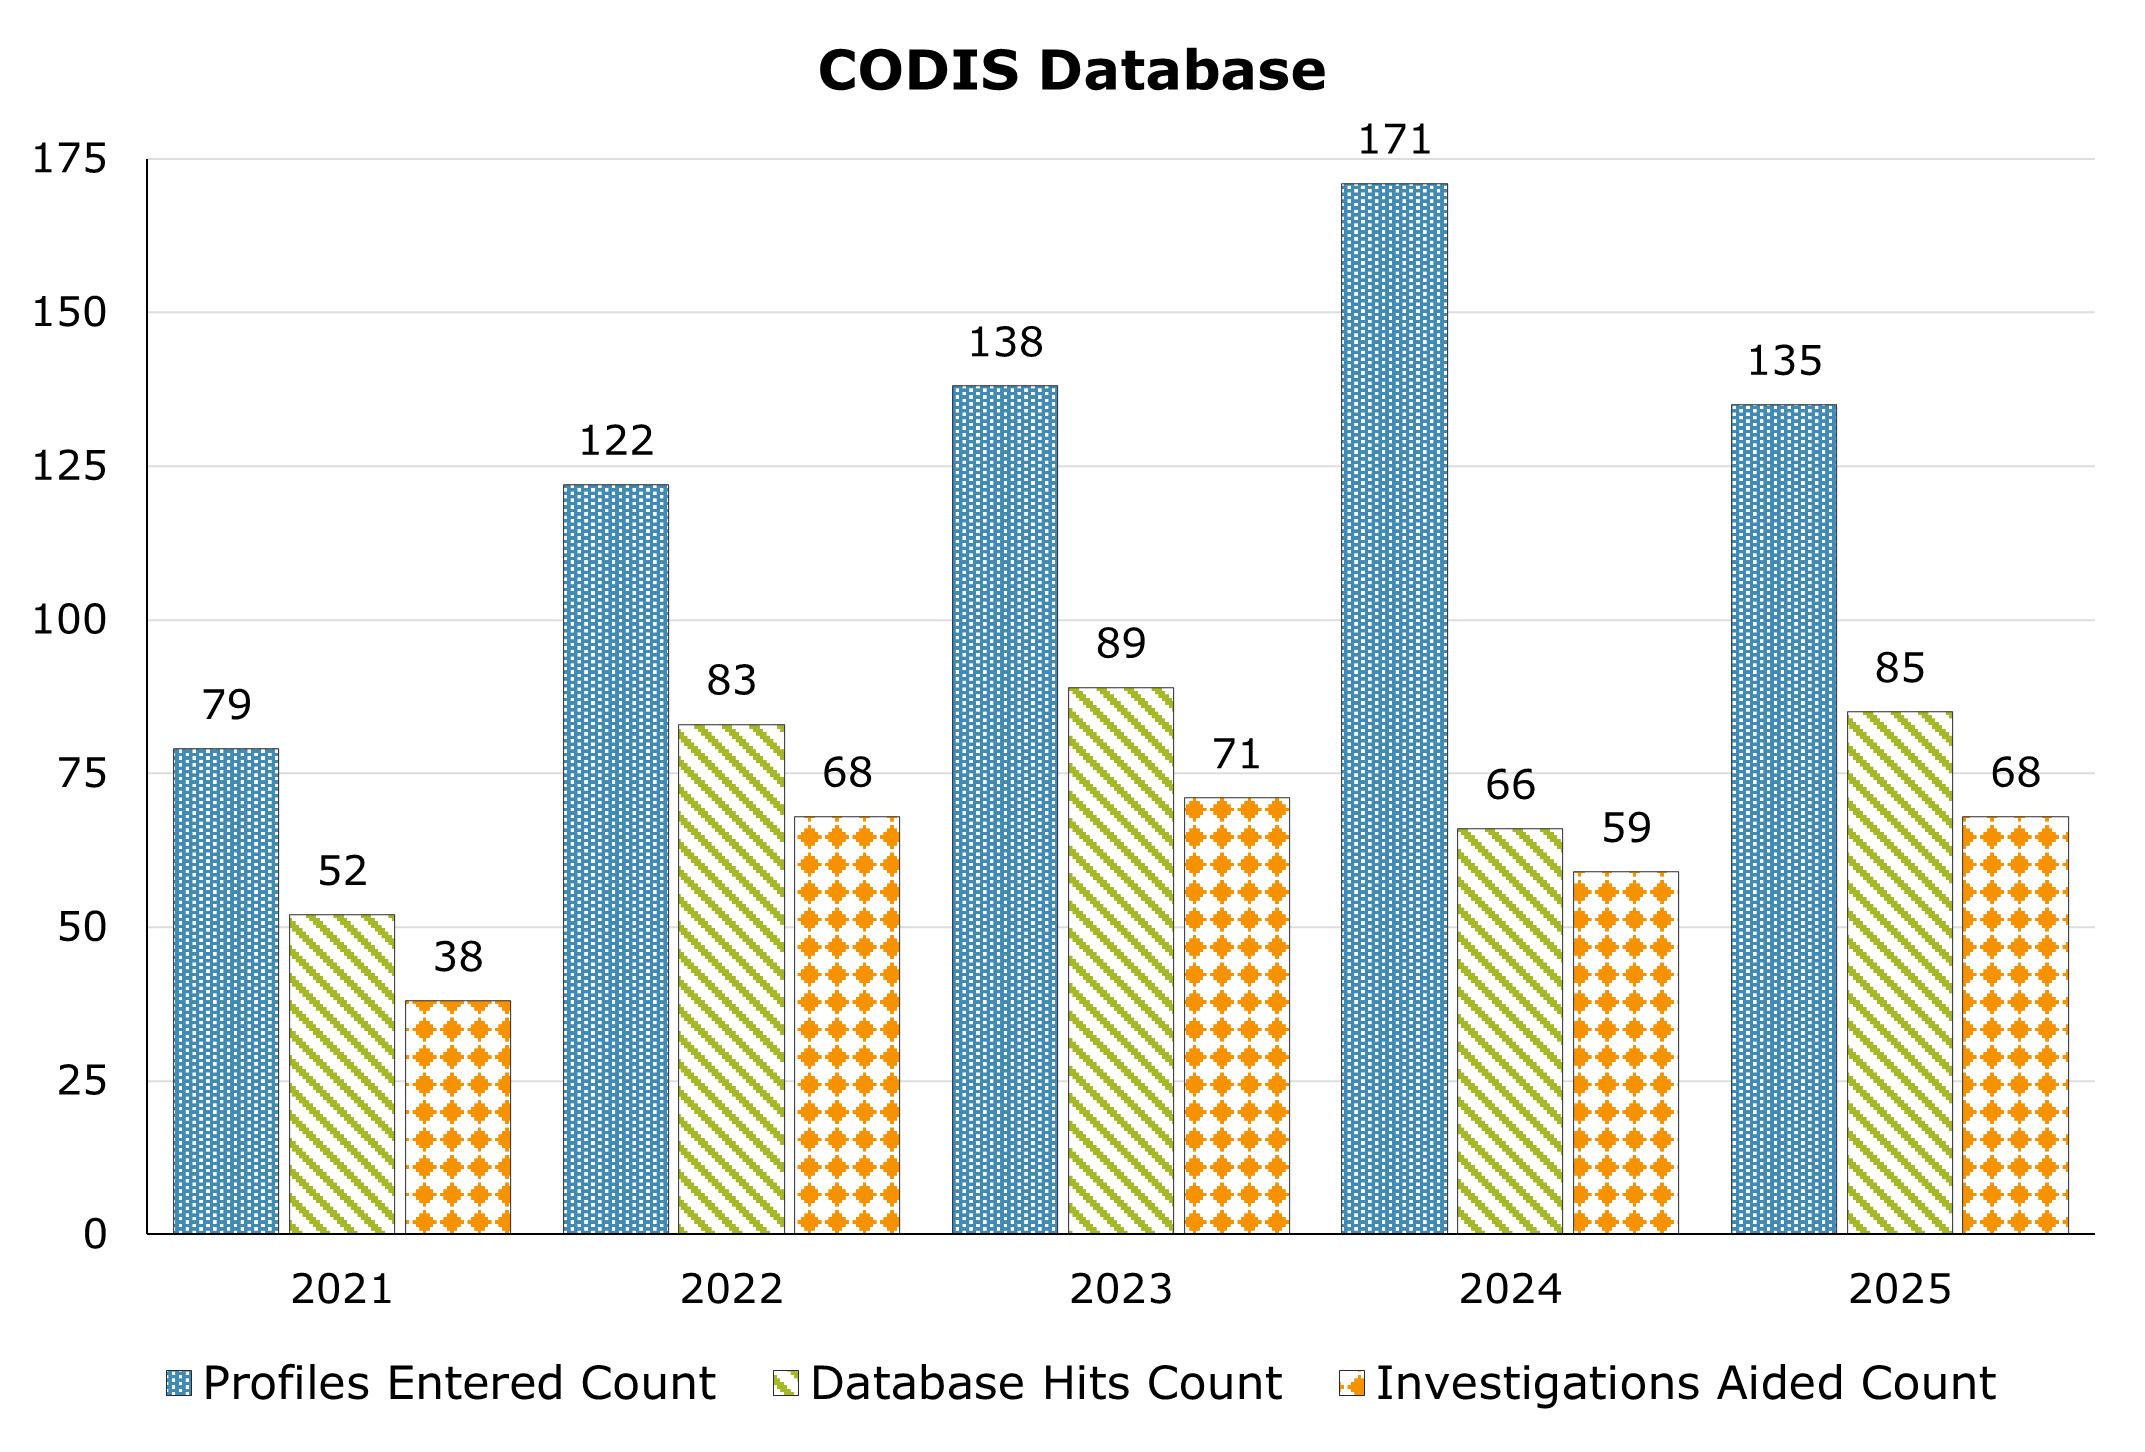
Figure 9 illustrates trends in CODIS activity. In 2025, the laboratory entered 135 profiles into CODIS, recorded 85 database hits, and aided 68 investigations. Over the past five years, the laboratory averaged 129 case profiles entered into CODIS annually, approximately 75 hits per year, and approximately 60 investigations aided per year. As of the end of 2025, the total number of profiles maintained in LDIS was 2,754.
| 2021 | 2022 | 2023 | 2024 | 2025 | |
|---|---|---|---|---|---|
| Profiles Entered Count | 79 | 122 | 138 | 171 | 135 |
| Database Hits Count | 52 | 83 | 89 | 66 | 85 |
| Investigations Aided Count | 38 | 68 | 71 | 59 | 68 |
Criminalistics
The Criminalistics Unit conducts forensic examinations in Drug Identification, Firearms, and Fire Debris. Of the 1,013 new cases submitted to the unit, Drug Identification accounted for 84.01 percent, Firearms for 13.42 percent, and Fire Debris for 2.57 percent.
Drug Identification
The Drug Identification (Drug ID) Laboratory specializes in the analysis of unknown substances seized by law enforcement to determine whether they are illegal controlled substances. The laboratory provides scientific support for criminal investigations, including substance identification and the determination of the purity and quantity of analyzed materials.
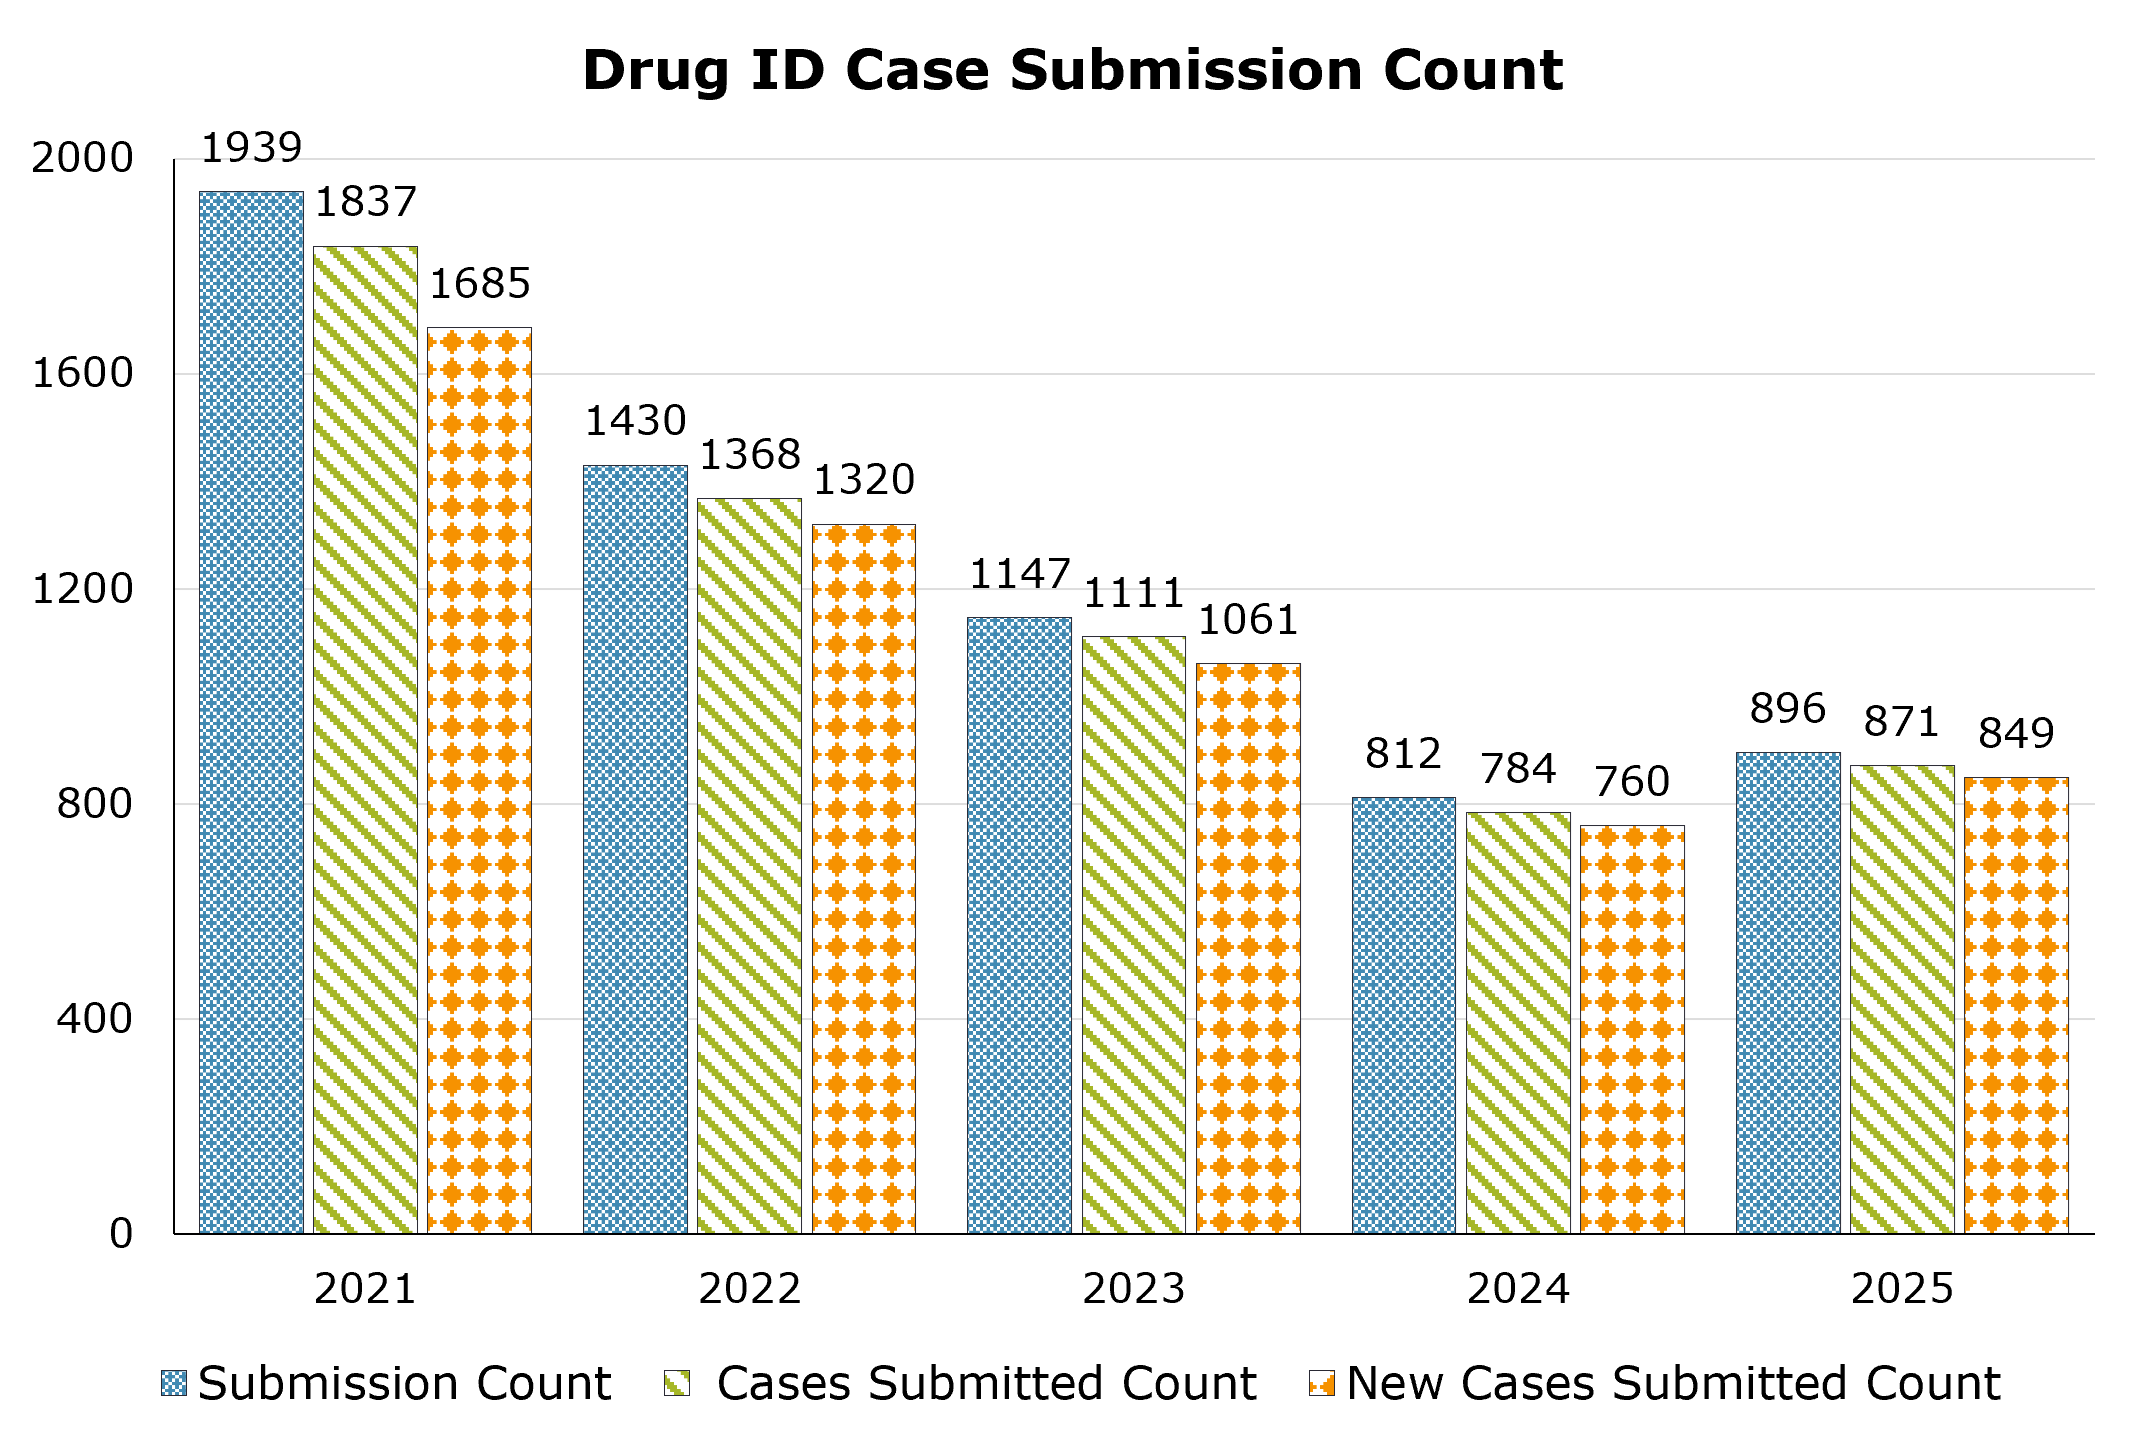
Figure 10 presents three related workload measures for the Drug ID Laboratory from 2021 through 2025: submission count, representing the number of evidence submissions; cases submitted, reflecting the total number of unique cases received, including both new and previously submitted cases; and new cases submitted, indicating first-time case submissions that create new laboratory case records. In 2025, the laboratory recorded 896 submissions, 871 cases submitted, and 849 new cases submitted. These figures continue the overall downward trend observed since the peak submission year in 2021, although a modest increase was recorded in 2025 compared with the previous year.
| 2021 | 2022 | 2023 | 2024 | 2025 | |
|---|---|---|---|---|---|
| Submission Count | 1939 | 1430 | 1147 | 812 | 896 |
| Cases Submitted Count | 1837 | 1368 | 1111 | 784 | 871 |
| New Cases Submitted Count | 1685 | 120 | 1061 | 760 | 849 |
The Wichita Police Department accounted for the largest share of case submissions to the Drug ID Laboratory at 39.64 percent, followed by the Sedgwick County Sheriff’s Office at 32.72 percent.
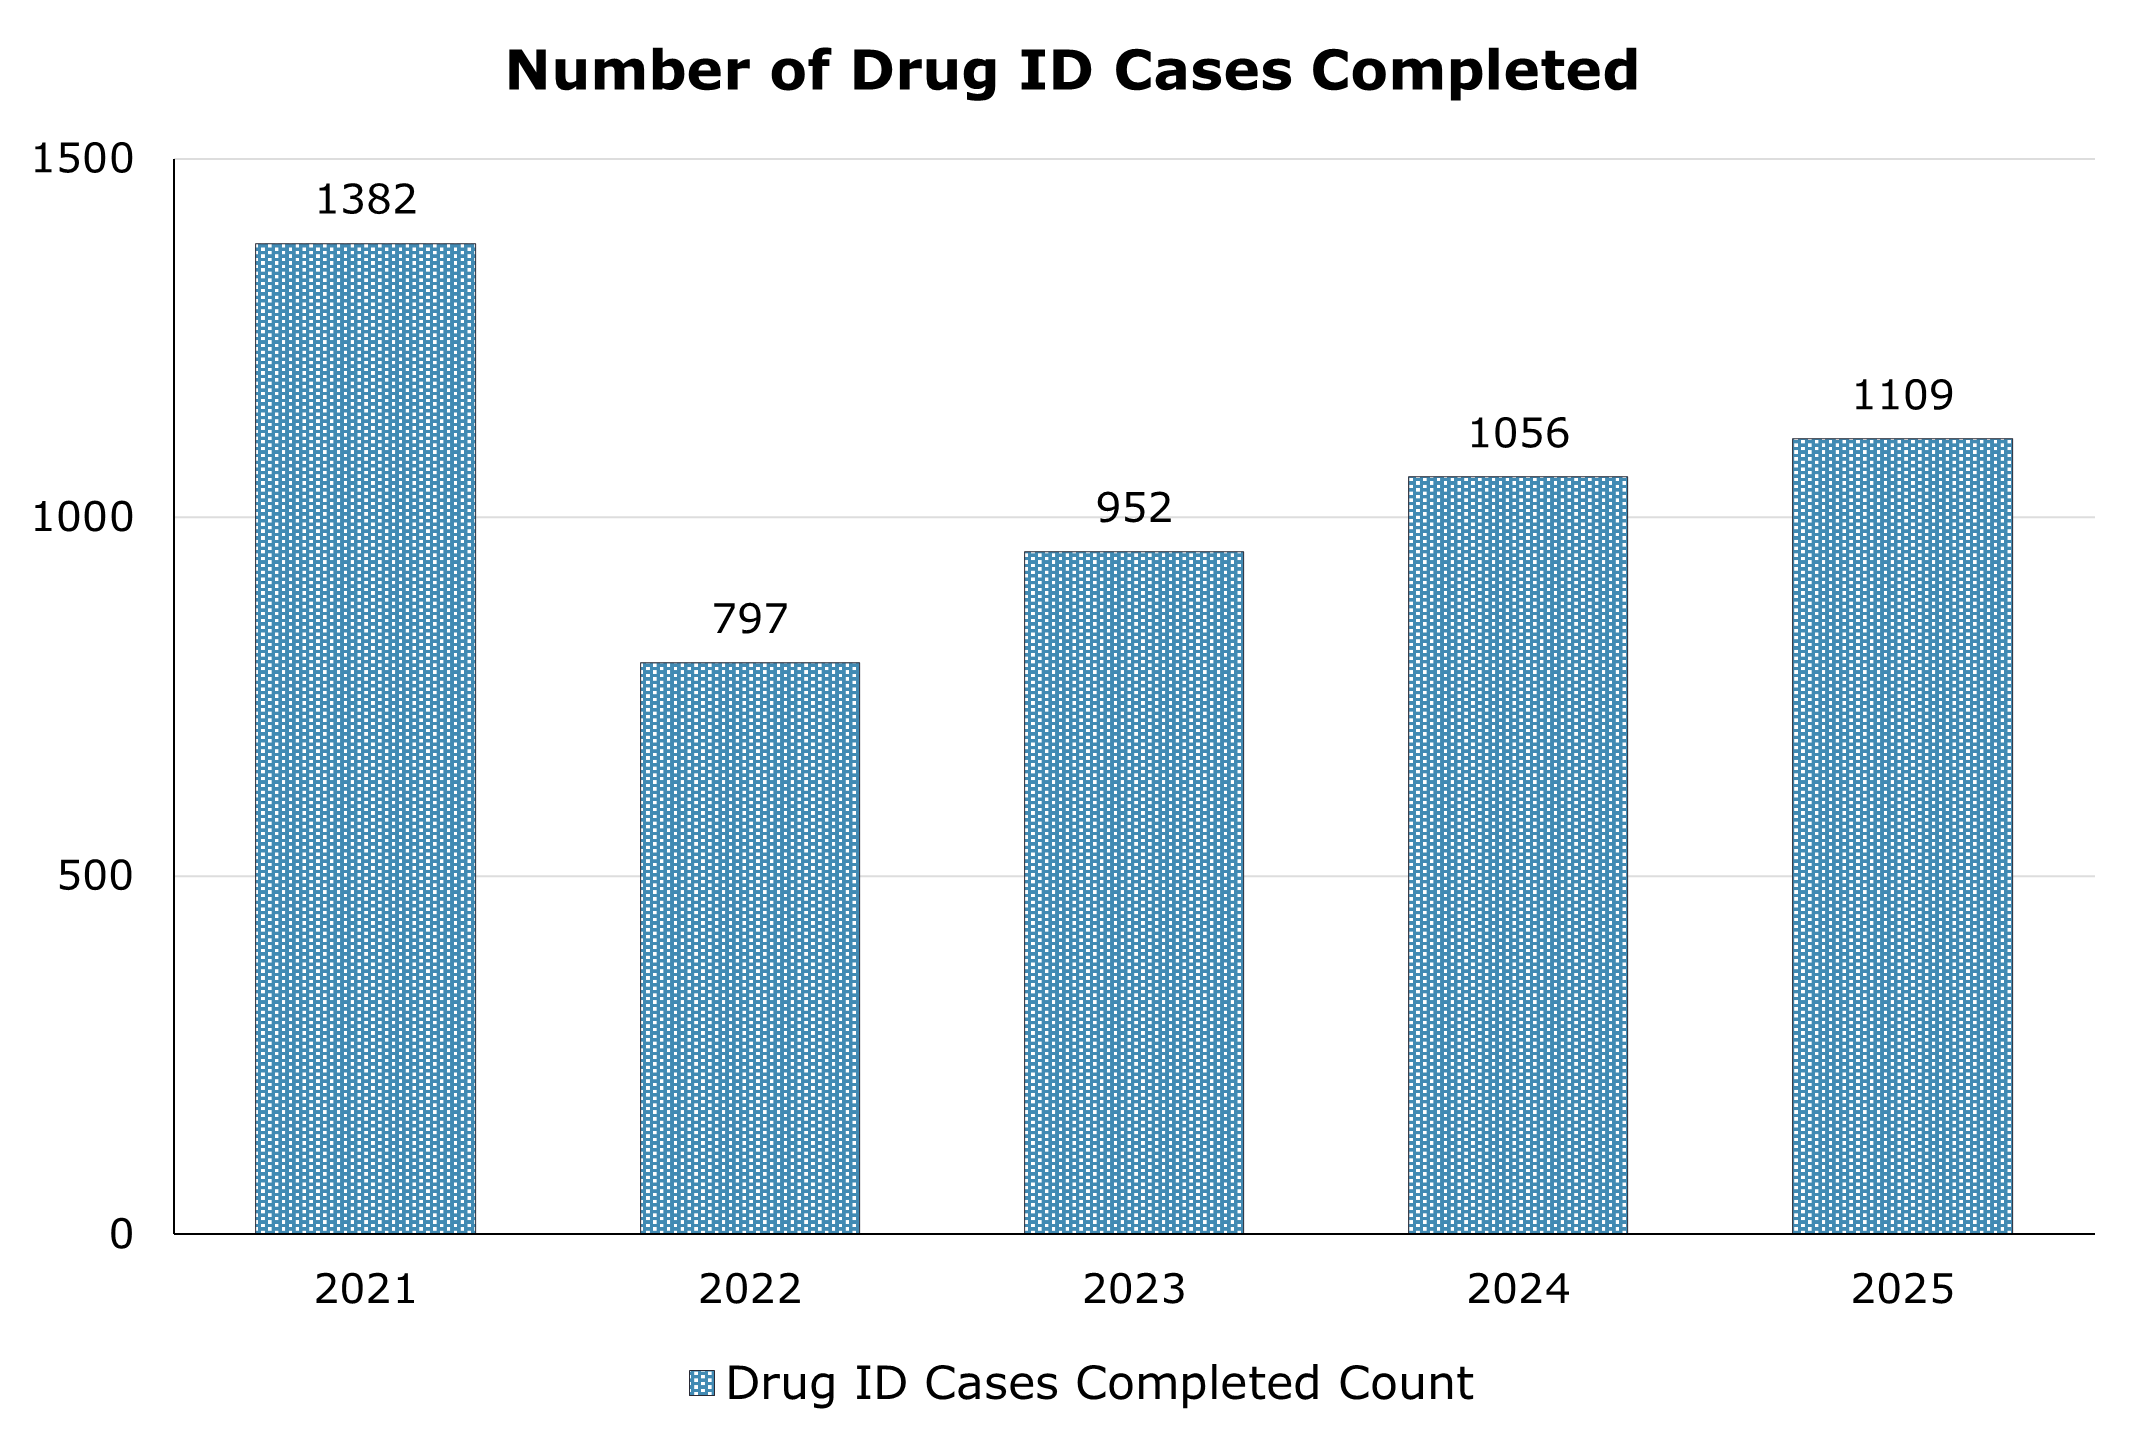
Figure 11 presents the number of cases completed by the Drug ID Laboratory from 2021 through 2025. The overall trend shows a substantial decline from 1,382 completed cases in 2021 to 797 in 2022, followed by consistent annual increases, reaching 1,109 completed cases in 2025. This pattern indicates a steady recovery in casework output.
| 2021 | 2022 | 2023 | 2024 | 2025 | |
|---|---|---|---|---|---|
| Number of Drug ID Cases Completed | 1382 | 797 | 952 | 1056 | 1109 |
Firearms
Firearm examinations are performed in support of state and federal law enforcement agencies. The Firearms Laboratory conducts a range of forensic examinations, including firearm operability testing, bullet and projectile comparisons, cartridge case comparisons, and serial number restorations. Of the 142 cases submitted, 124 cases (87.32 percent) involved operability (function) testing of submitted firearms.
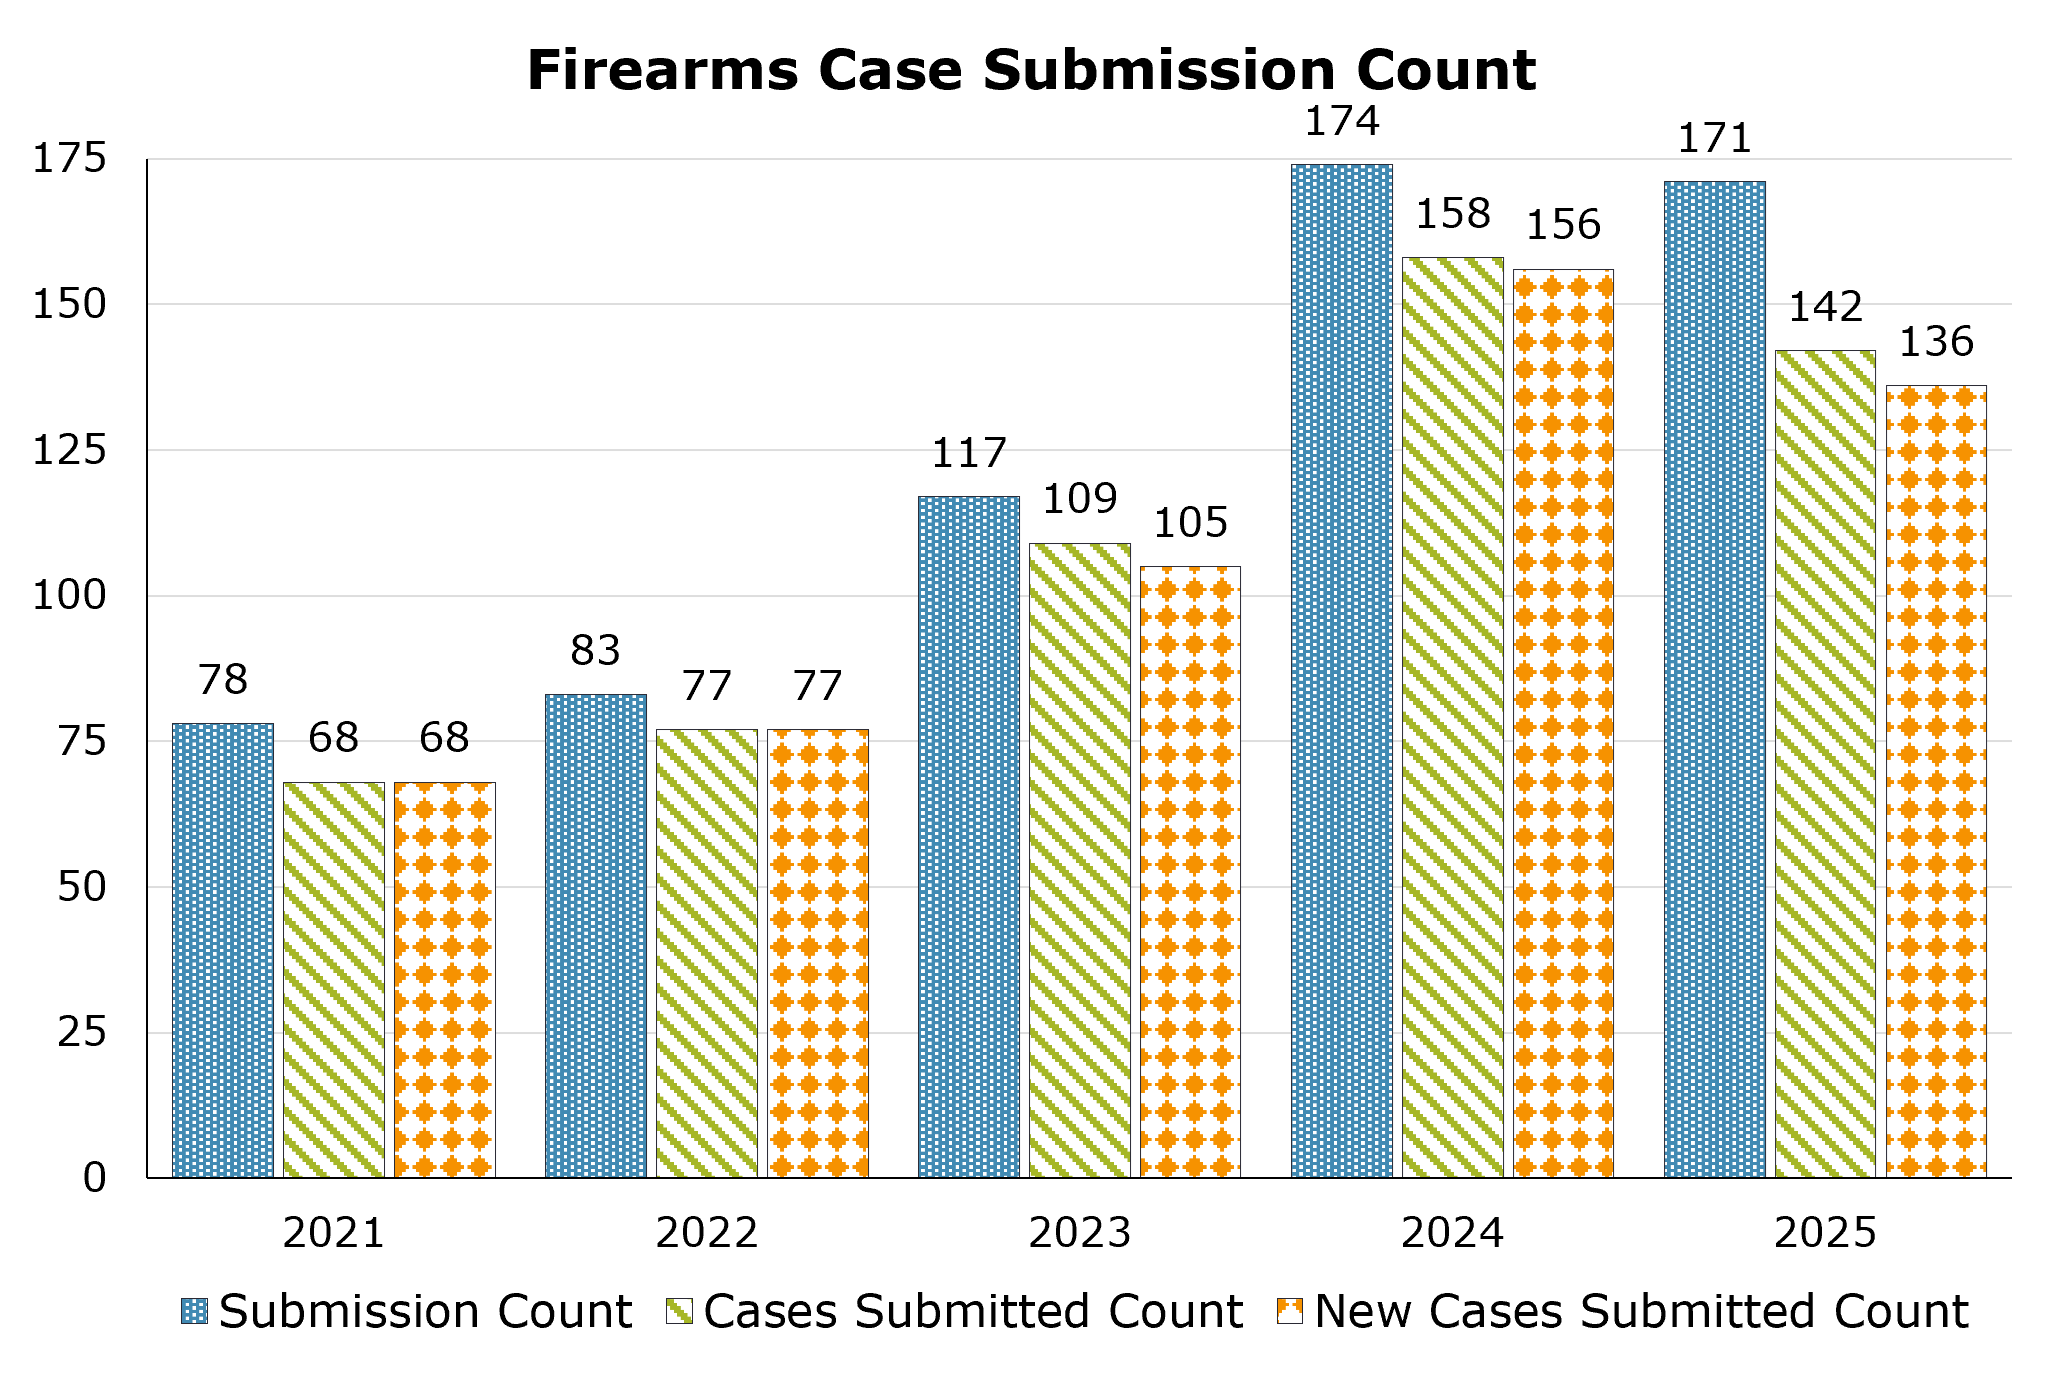
Figure 12 presents three related workload measures for the Firearms Laboratory between 2021 and 2025: the submission count, representing the number of evidence submissions; the cases submitted count, reflecting total unique cases received – including new and previously submitted cases; and the new cases submitted count, indicating first-time case submissions that generate new laboratory case records. In 2025, the laboratory recorded 171 submissions, 142 cases submitted, and 136 new cases submitted. Overall, these measures increased from 2021 through 2024, then remained relatively stable over the final two years.
| 2021 | 2022 | 2023 | 2024 | 2025 | |
|---|---|---|---|---|---|
| Submission Count | 78 | 83 | 117 | 174 | 171 |
| Cases Submitted Count | 68 | 77 | 109 | 158 | 142 |
| New Cases Submitted Count | 68 | 77 | 105 | 156 | 136 |
Table 6 presents the number of requests for each examination type—function testing, bullet/projectile comparisons, cartridge case comparisons, and serial number restorations—from 2022 through 2025. Overall, requests for most examination types increased between 2022 and 2024. Serial number restorations were the exception, showing a slight decline from 2022 while remaining consistent with the 2023 level. In 2025, requests decreased slightly across all examination types except serial number restorations, which increased from 2 to 3.
| Function Test | Bullet/Projectile Comparison | Cartridge Case Comparison | Serial Number Restoration | |
|---|---|---|---|---|
|
2022 |
73 |
3 |
5 |
5 |
|
2023 |
95 |
14 |
19 |
2 |
|
2024 |
136 |
49 |
64 |
2 |
|
2025 |
124 |
41 |
62 |
3 |
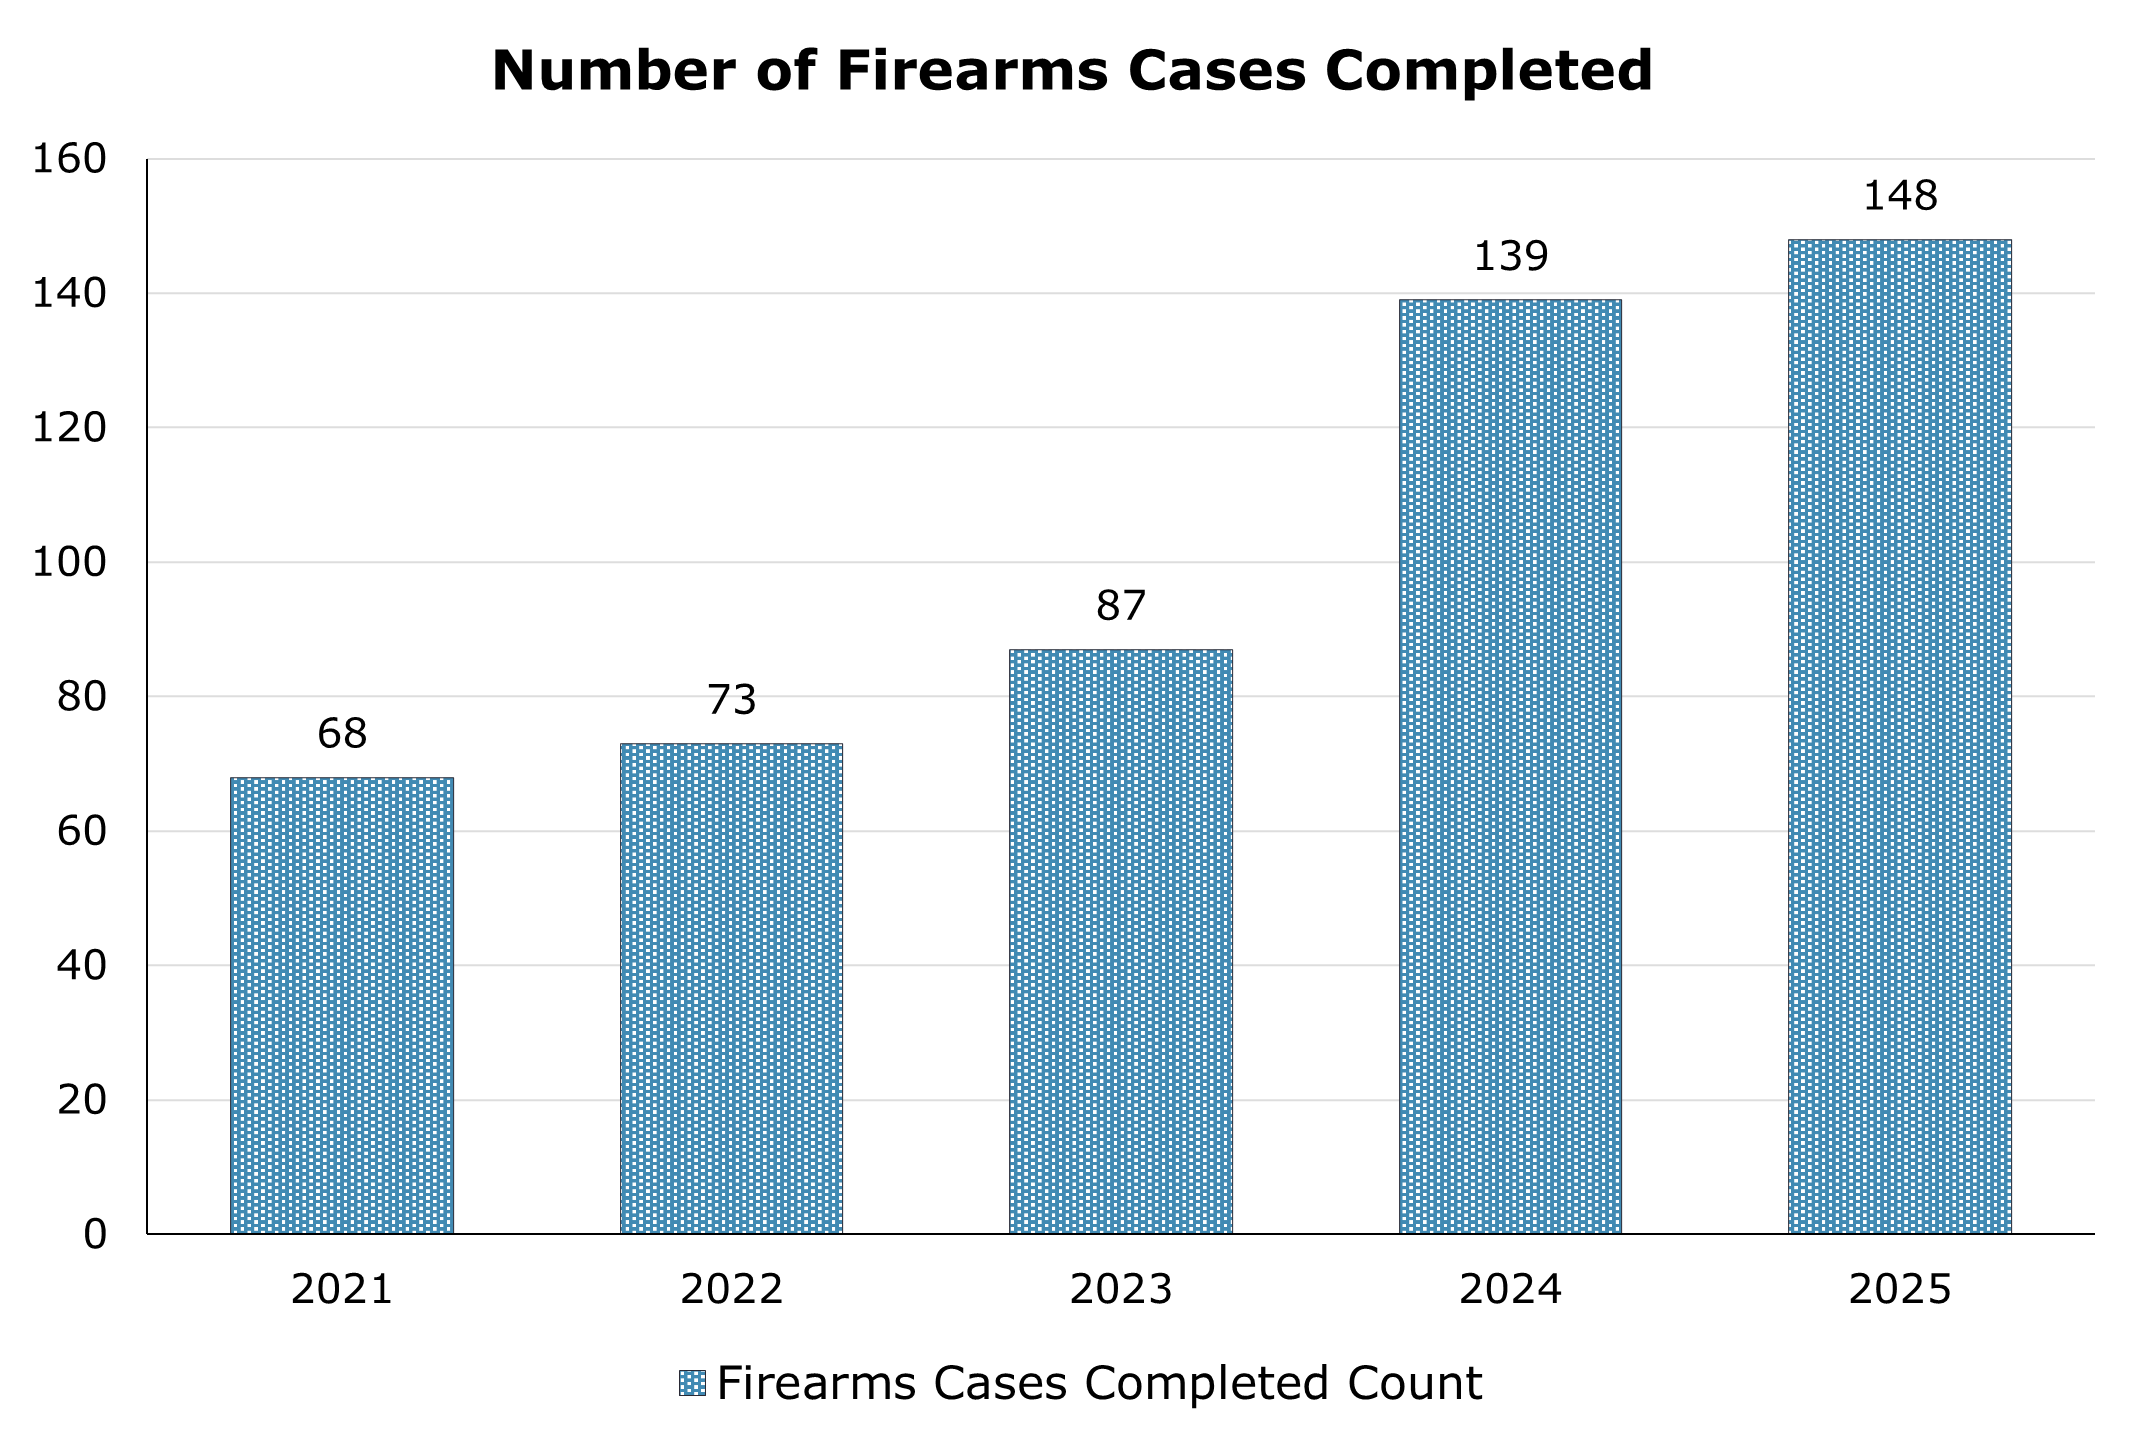
Figure 13 shows the number of cases completed by the Firearms Laboratory from 2021 through 2025. The data show a sustained increase over this period, rising from 68 completed cases in 2021 to 148 in 2025.
| 2021 | 2022 | 2023 | 2024 | 2025 | |
|---|---|---|---|---|---|
| Number of Firearms Cases Completed | 68 | 73 | 87 | 139 | 148 |
Fire Debris
The Fire Debris Laboratory examines fire debris evidence in support of fire investigations. The information provided to the investigator assists in determining if a fire was accidentally or intentionally set for purposes ranging from insurance fraud to homicide.
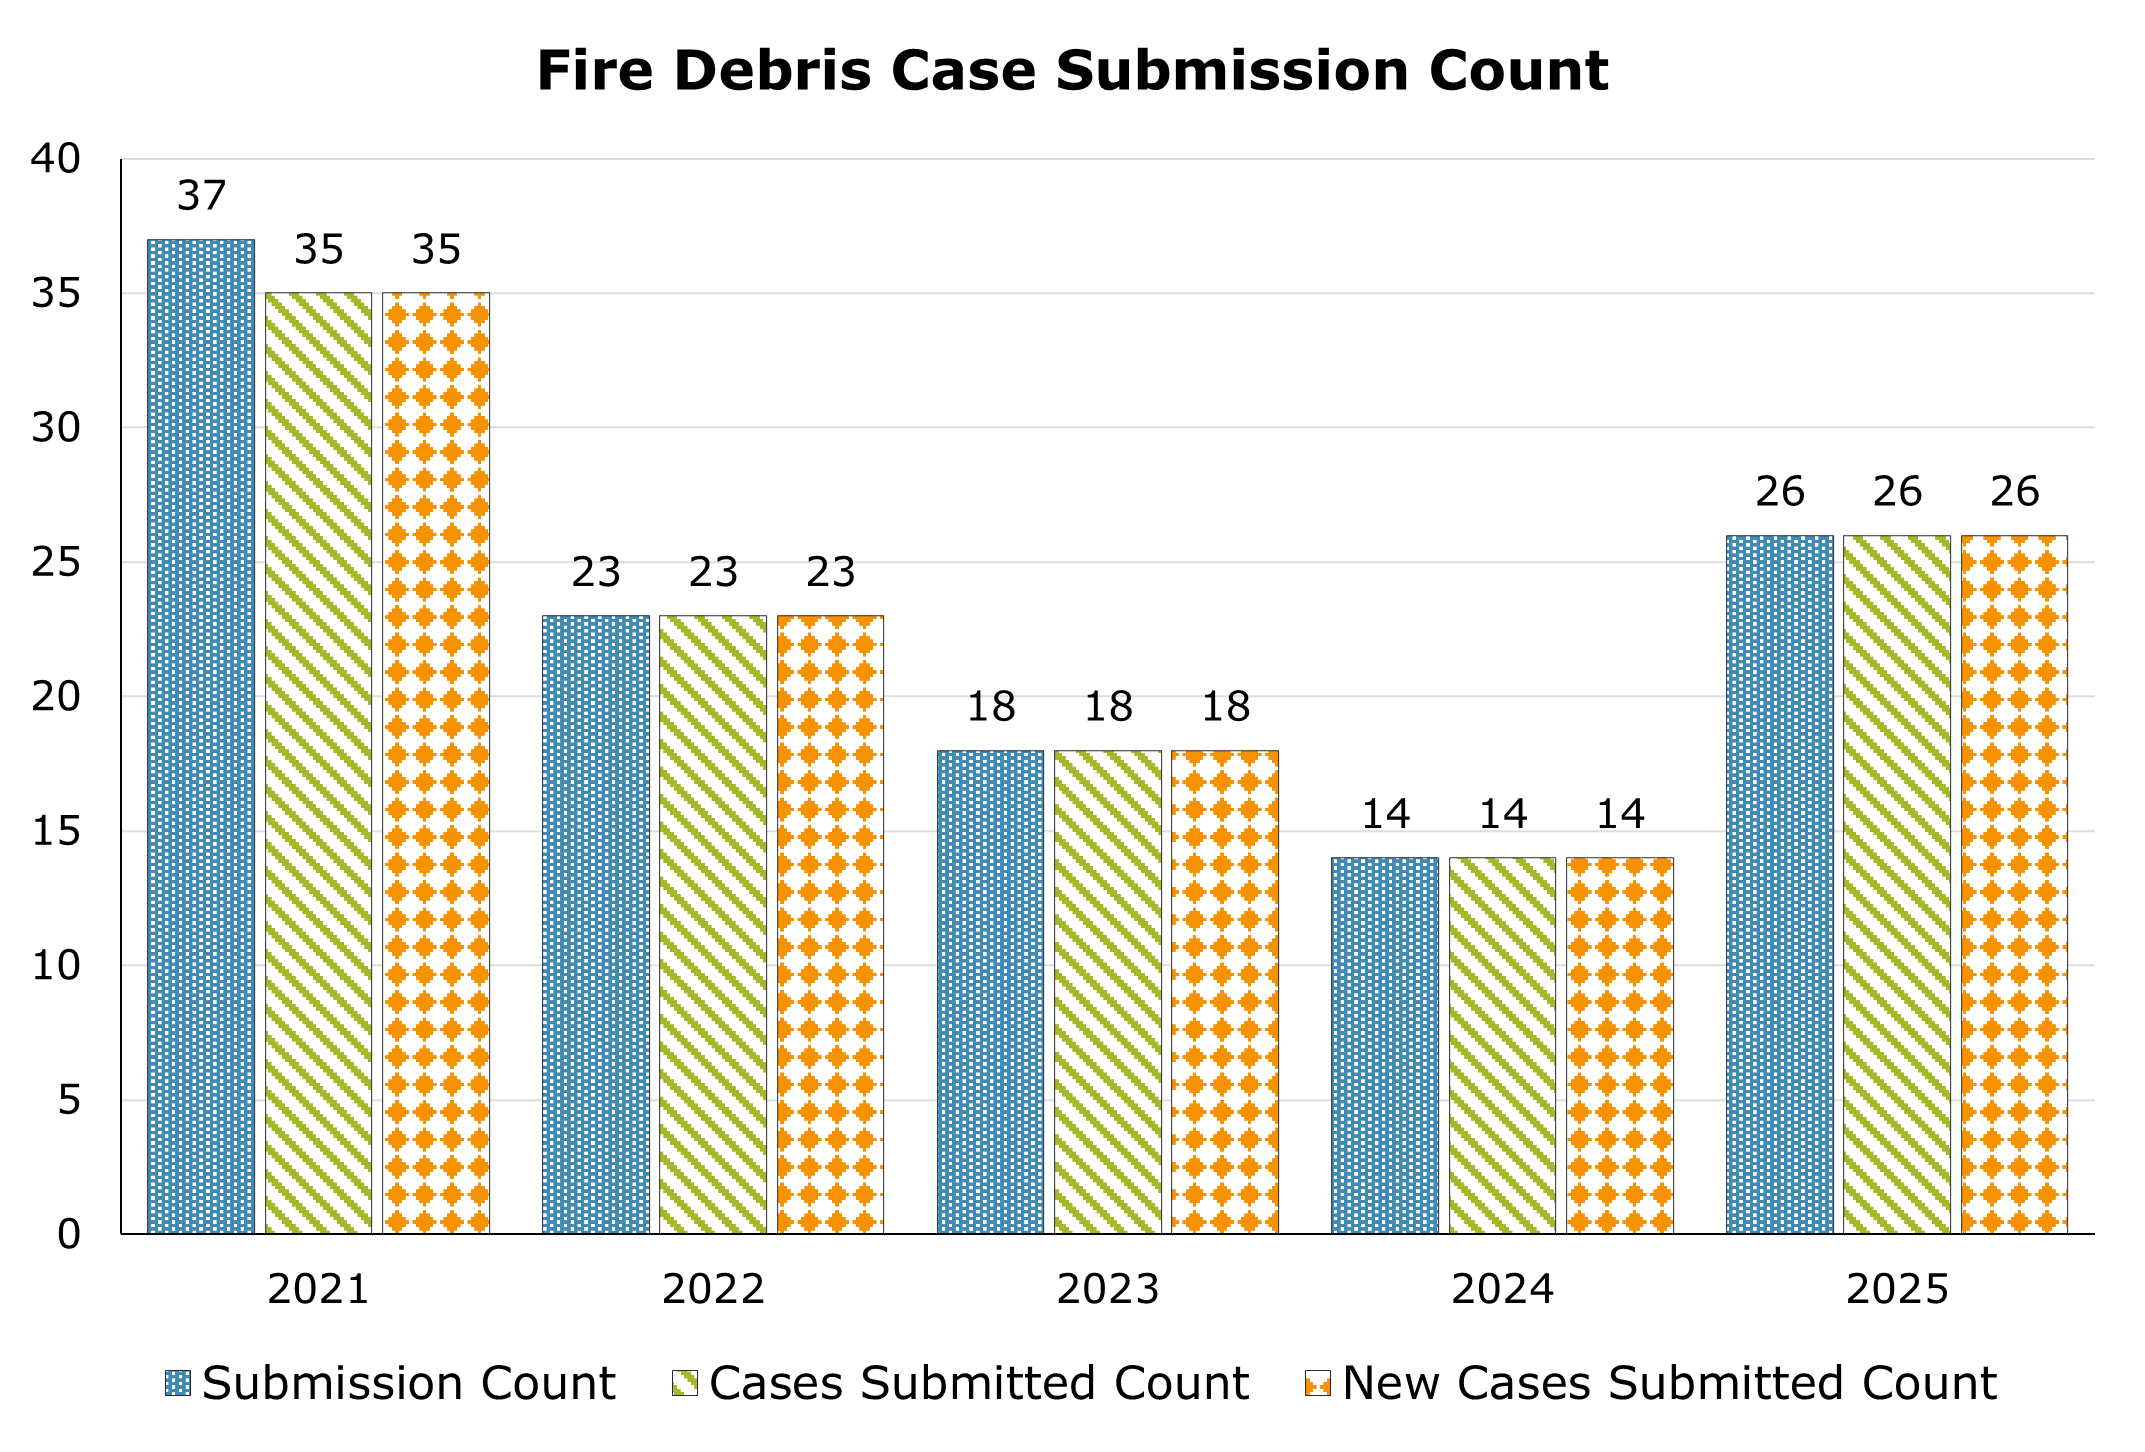
Figure 14 presents three related workload measures for the Fire Debris Laboratory between 2021 and 2025: the submission count, representing the number of evidence submissions; the cases submitted count, reflecting total unique cases received – including new and previously submitted cases; and the new cases submitted count, indicating first-time case submissions that generate new laboratory case records. In 2025, the laboratory recorded 26 submissions, 26 cases submitted, and 26 new cases submitted. These measures declined from 2021 through 2024, followed by an increase in 2025, when all three submission measures reached their second-highest levels for the period.
| 2021 | 2022 | 2023 | 2024 | 2025 | |
|---|---|---|---|---|---|
| Submission Count | 37 | 23 | 18 | 14 | 26 |
| Cases Submitted Count | 35 | 23 | 18 | 14 | 26 |
| New Cases Submitted Count | 35 | 23 | 18 | 14 | 26 |
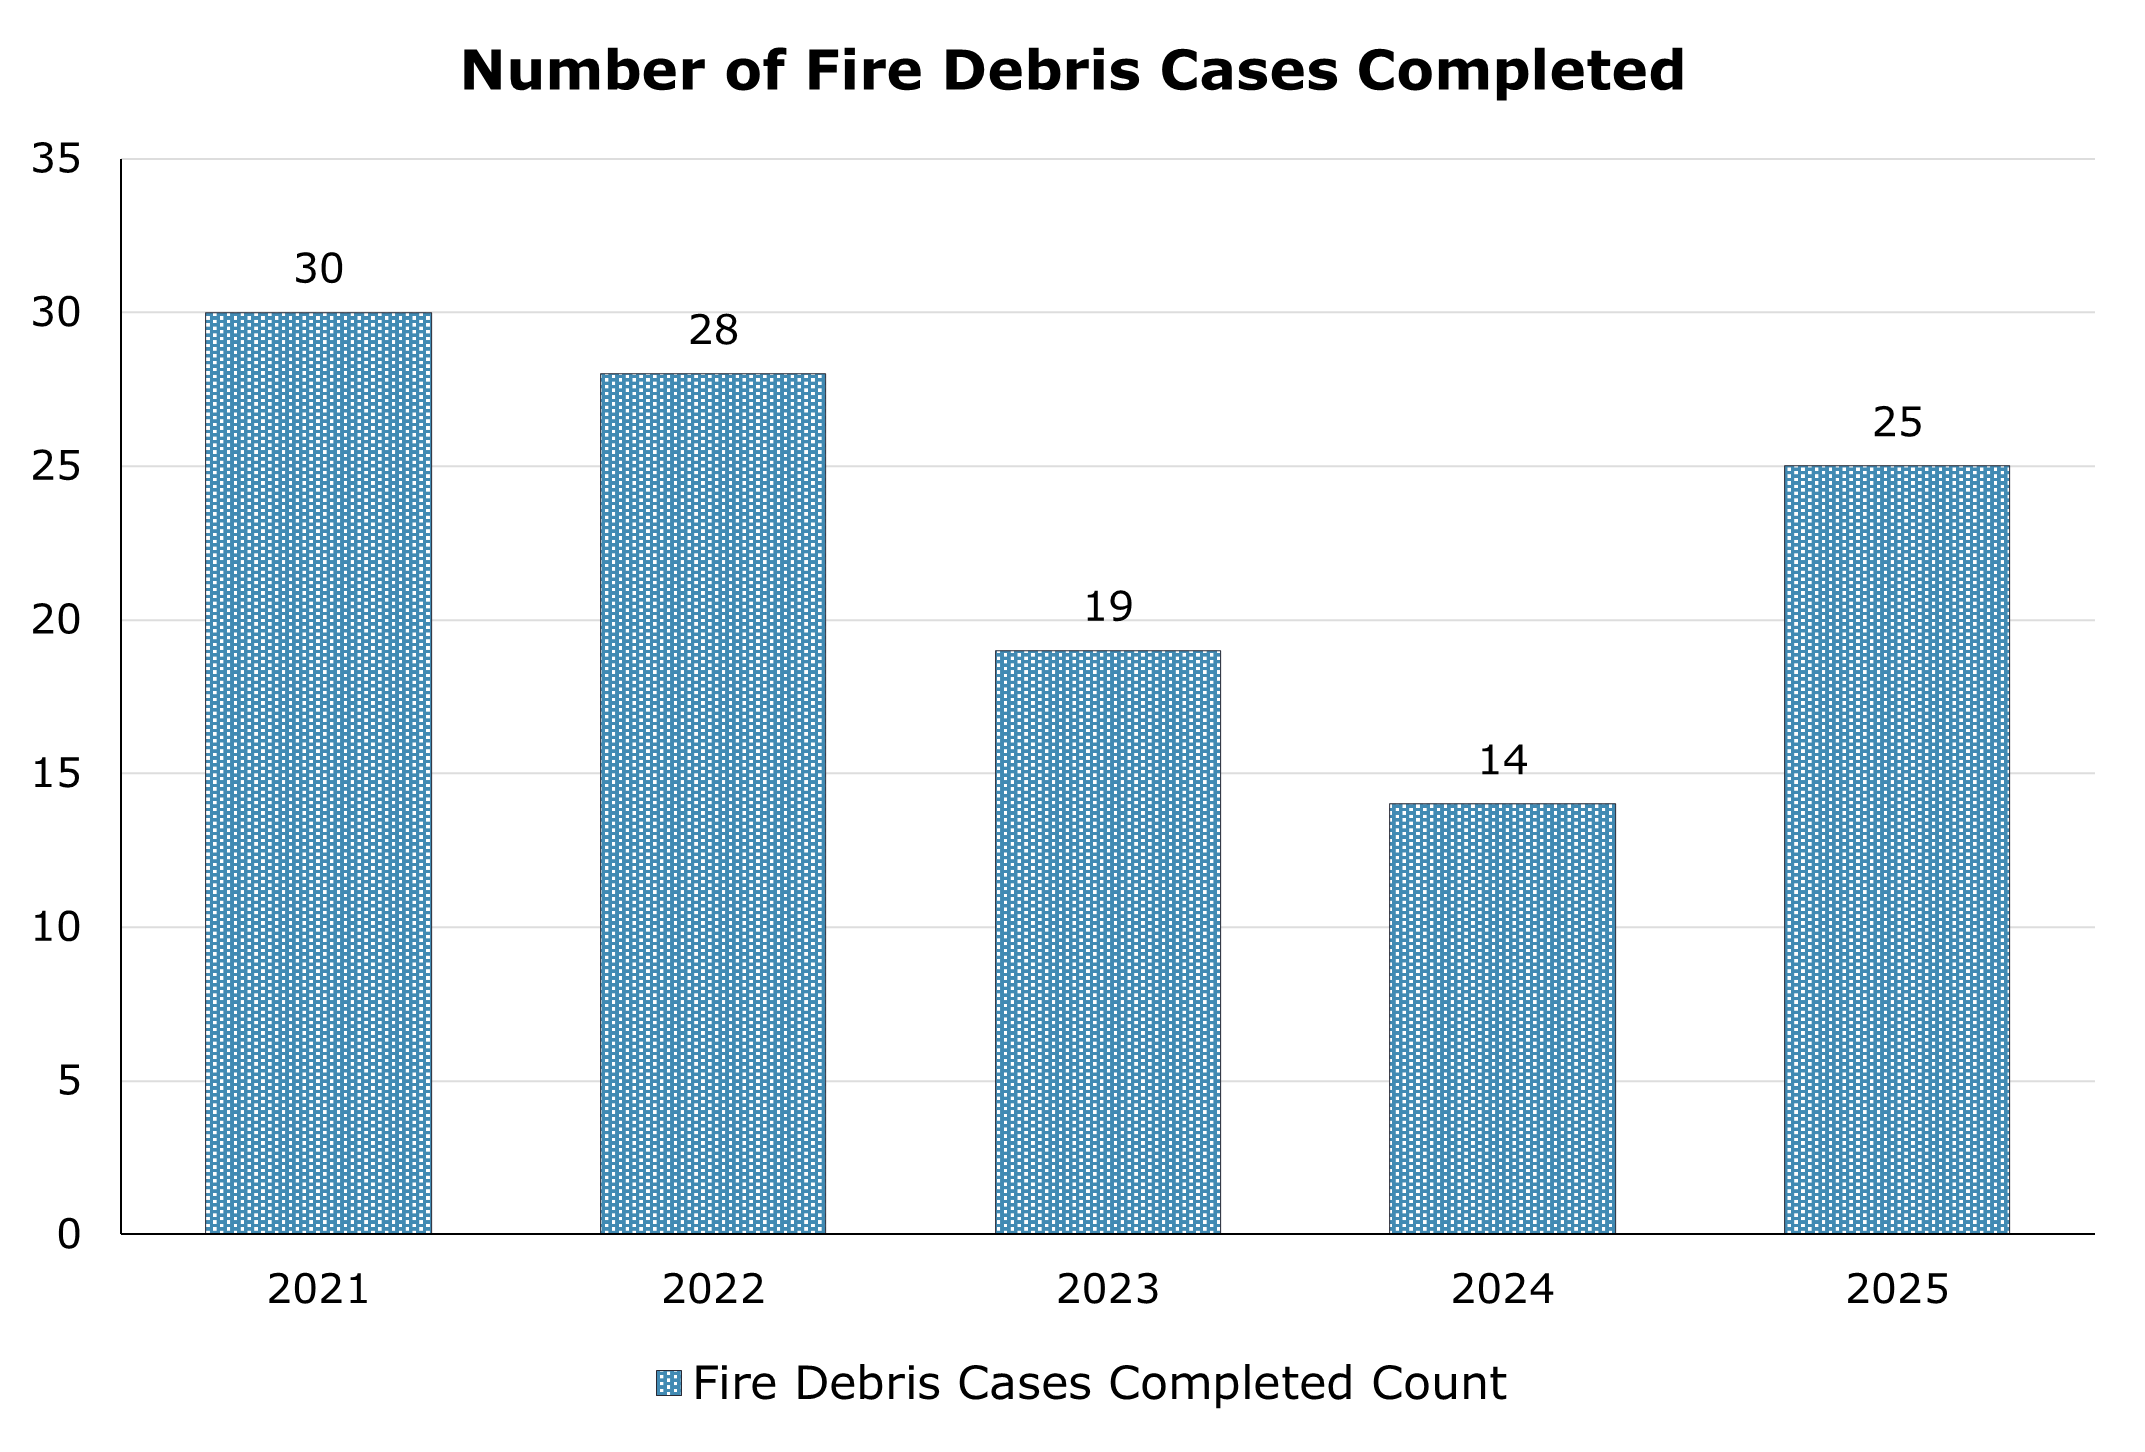
Figure 15 shows the number of cases completed by the Fire Debris Laboratory from 2021 through 2025. The overall pattern reflects a decline from 2021 through 2024, followed by an increase in 2025.
| 2021 | 2022 | 2023 | 2024 | 2025 | |
|---|---|---|---|---|---|
| Number of Fire Debris Cases Completed | 30 | 28 | 19 | 14 | 25 |
Toxicology
The Toxicology Laboratory provides comprehensive examinations of postmortem (autopsy) samples to assist in the determination of cause and manner of death. The remaining portion of cases are antemortem cases submitted by law enforcement for analysis. These include driving under the influence of alcohol (DUI), driving under the influence of drug (DUID), drug-facilitated sexual assault (DFSA), and other case types.
Due to the continuously emerging drugs that are available for use and/or abuse, the laboratory is constantly expanding the number of drugs and poisons it can detect and quantitate.
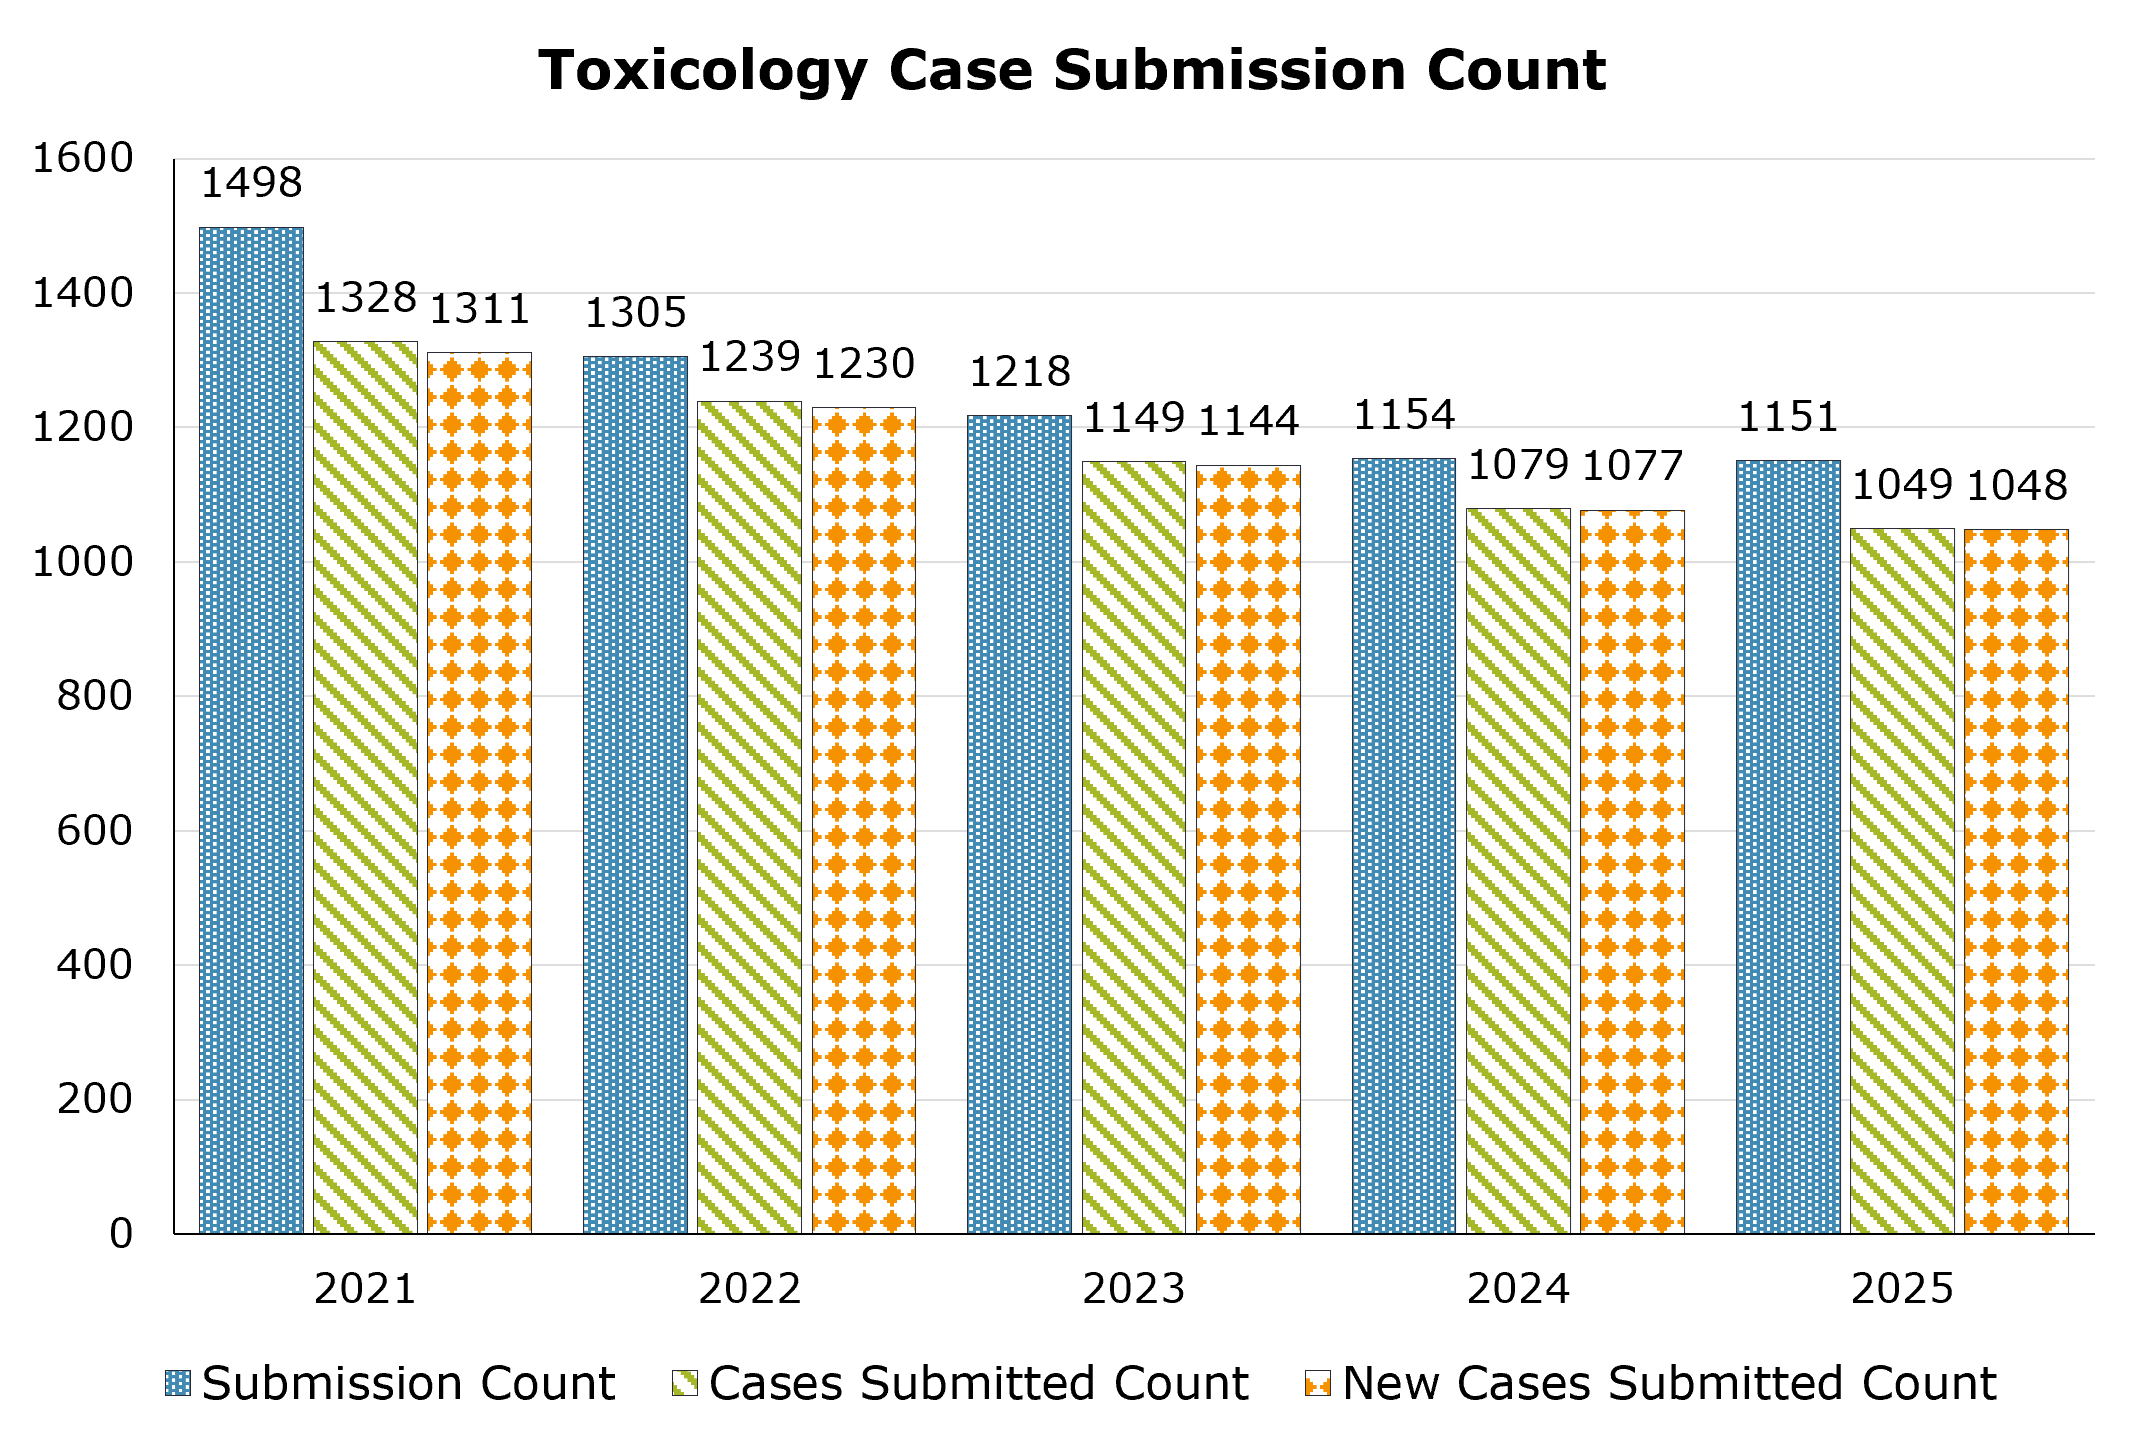
Figure 16 presents three related workload measures for the Toxicology Laboratory between 2021 and 2025: the submission count, representing the number of evidence submissions; the cases submitted count, reflecting total unique cases received – including new and previously submitted cases; and the new cases submitted count, indicating first-time case submissions that generate new laboratory case records. In 2025, the laboratory recorded 1,151 submissions, 1,048 cases submitted, and 1,047 new cases submitted. These figures indicate a decline from the 2021 peak but remain relatively stable across the remaining three years, suggesting that the peak seen in 2021 had a higher-than-normal number of case submissions.
Postmortem toxicological examinations in support of the Sedgwick County Coroner account for approximately 76.04 percent of the newly submitted cases that were submitted to the Toxicology Laboratory. The percentage of antemortem toxicological examinations in support of law enforcement investigations accounted for 23.95 percent, with 22.23 percent being for driving (DUI/DUID) cases, 1.52 percent being for drug-facilitated sexual assaults (DFSA) cases, and 0.19 percent being for all other case types.
| 2021 | 2022 | 2023 | 2024 | 2025 | |
|---|---|---|---|---|---|
| Submission Count | 1498 | 1305 | 1218 | 1154 | 1151 |
| Cases Submitted Count | 1328 | 1239 | 1149 | 1079 | 1049 |
| New Cases Submitted Count | 1311 | 1230 | 1144 | 1077 | 1048 |
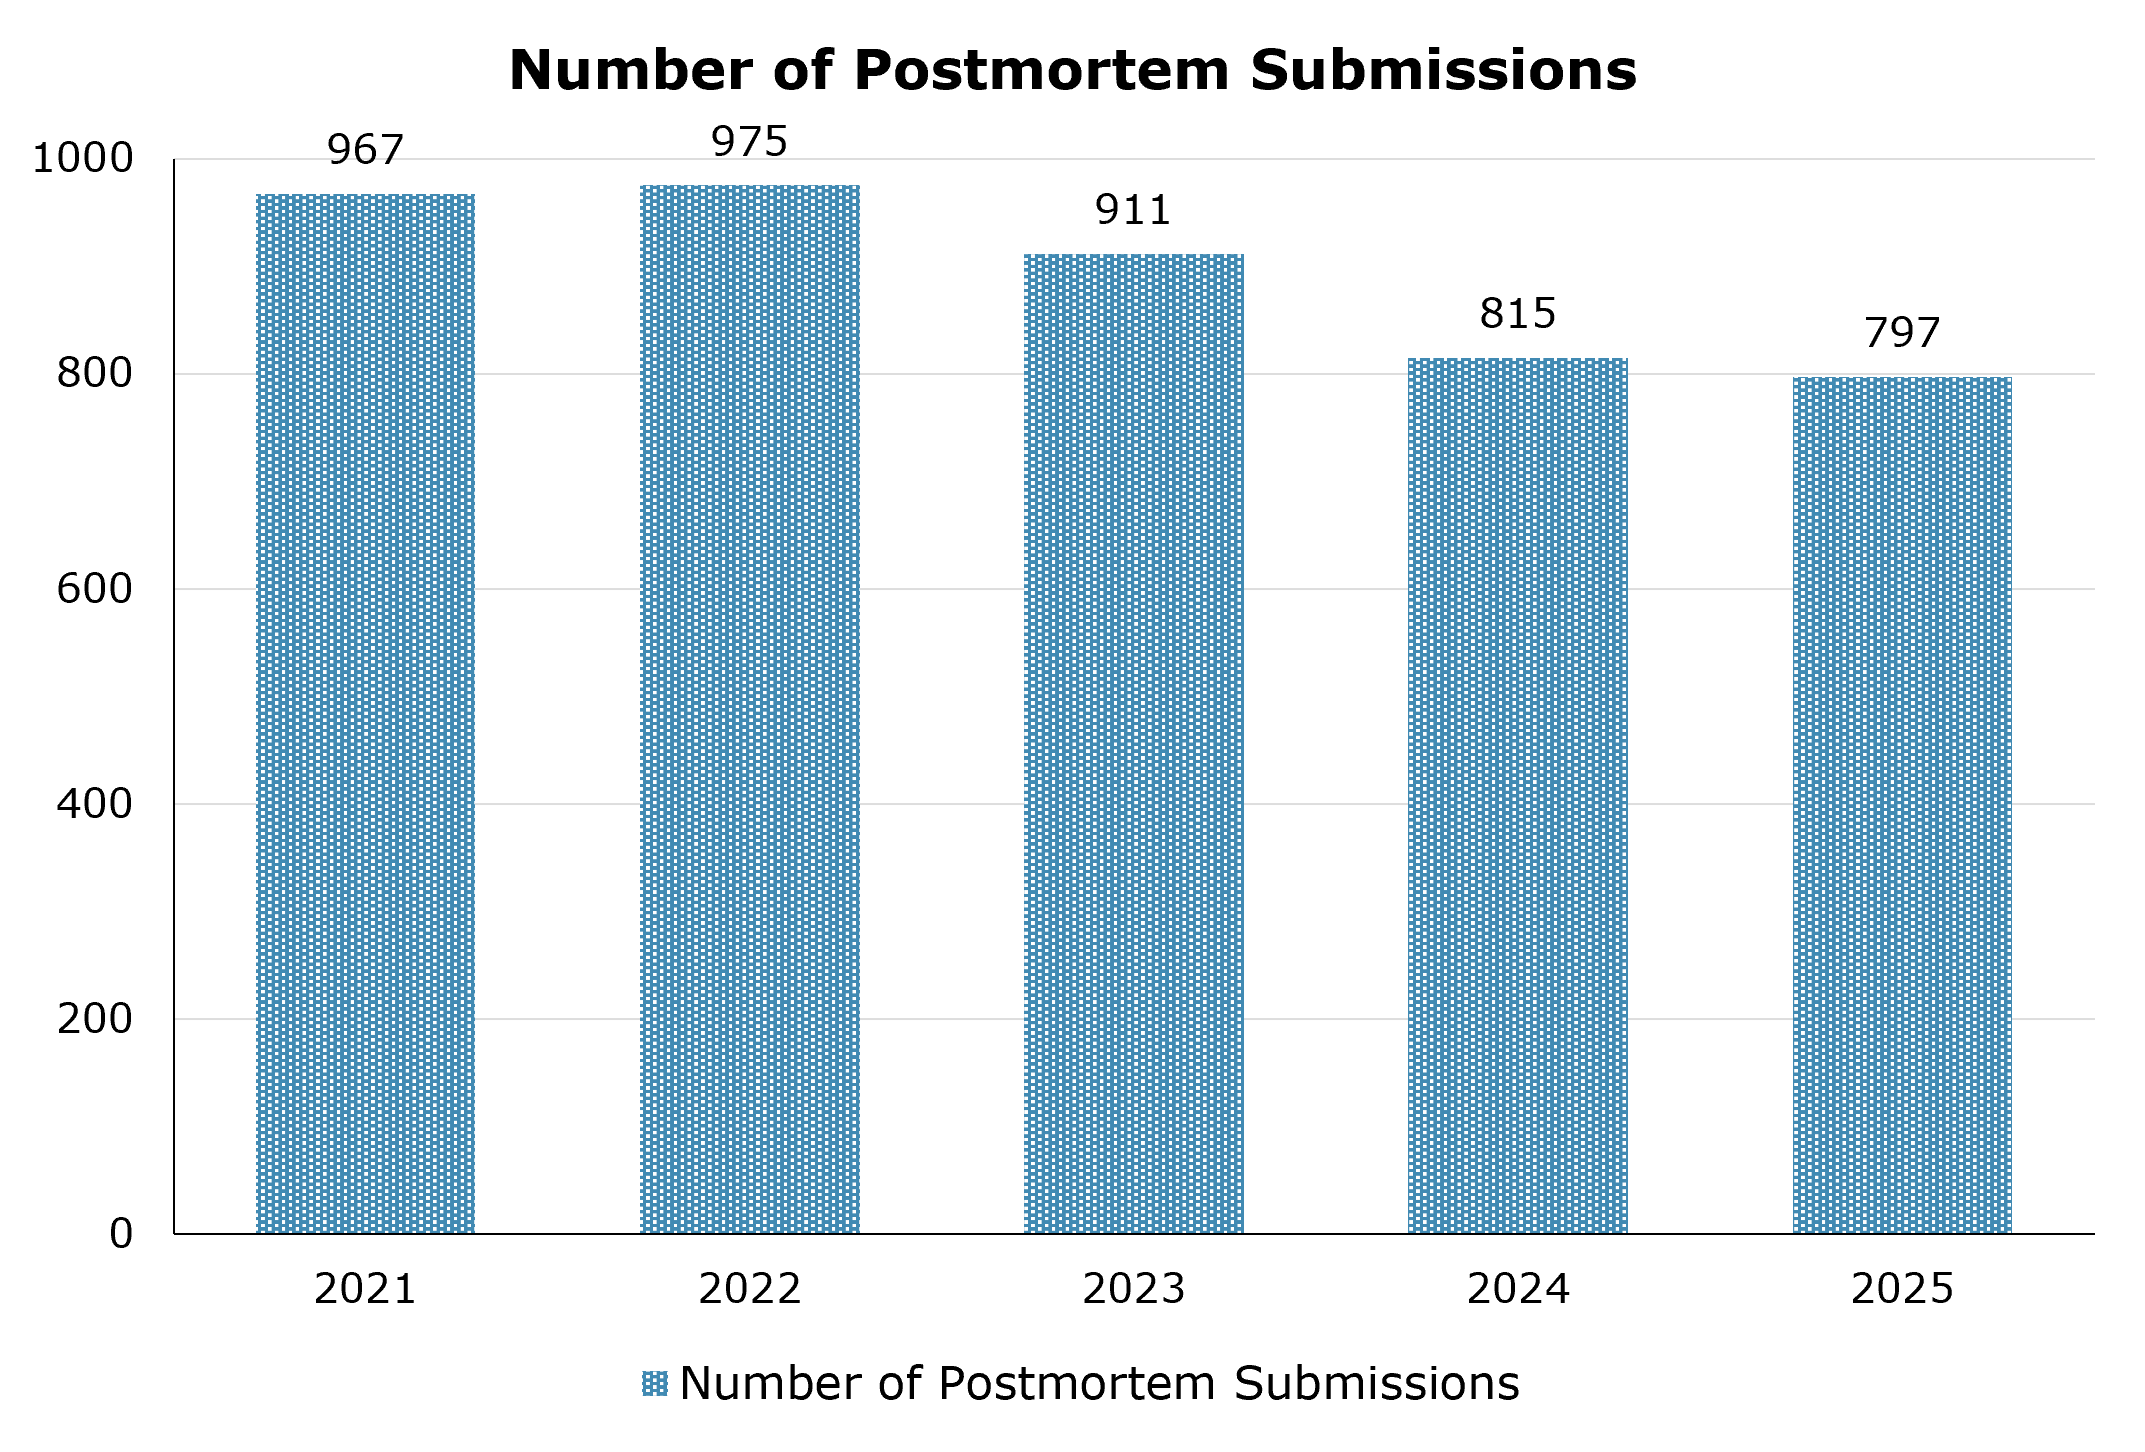
Figure 17 illustrates the number of new postmortem case submissions to the Toxicology Laboratory between 2021 and 2025. The number of new postmortem submissions trended downward over this period, with the highest total occurring in 2022 at 975 cases and the 2025 total at 797.
| 2021 | 2022 | 2023 | 2024 | 2025 | |
|---|---|---|---|---|---|
| Number of Submissions | 967 | 975 | 911 | 815 | 797 |
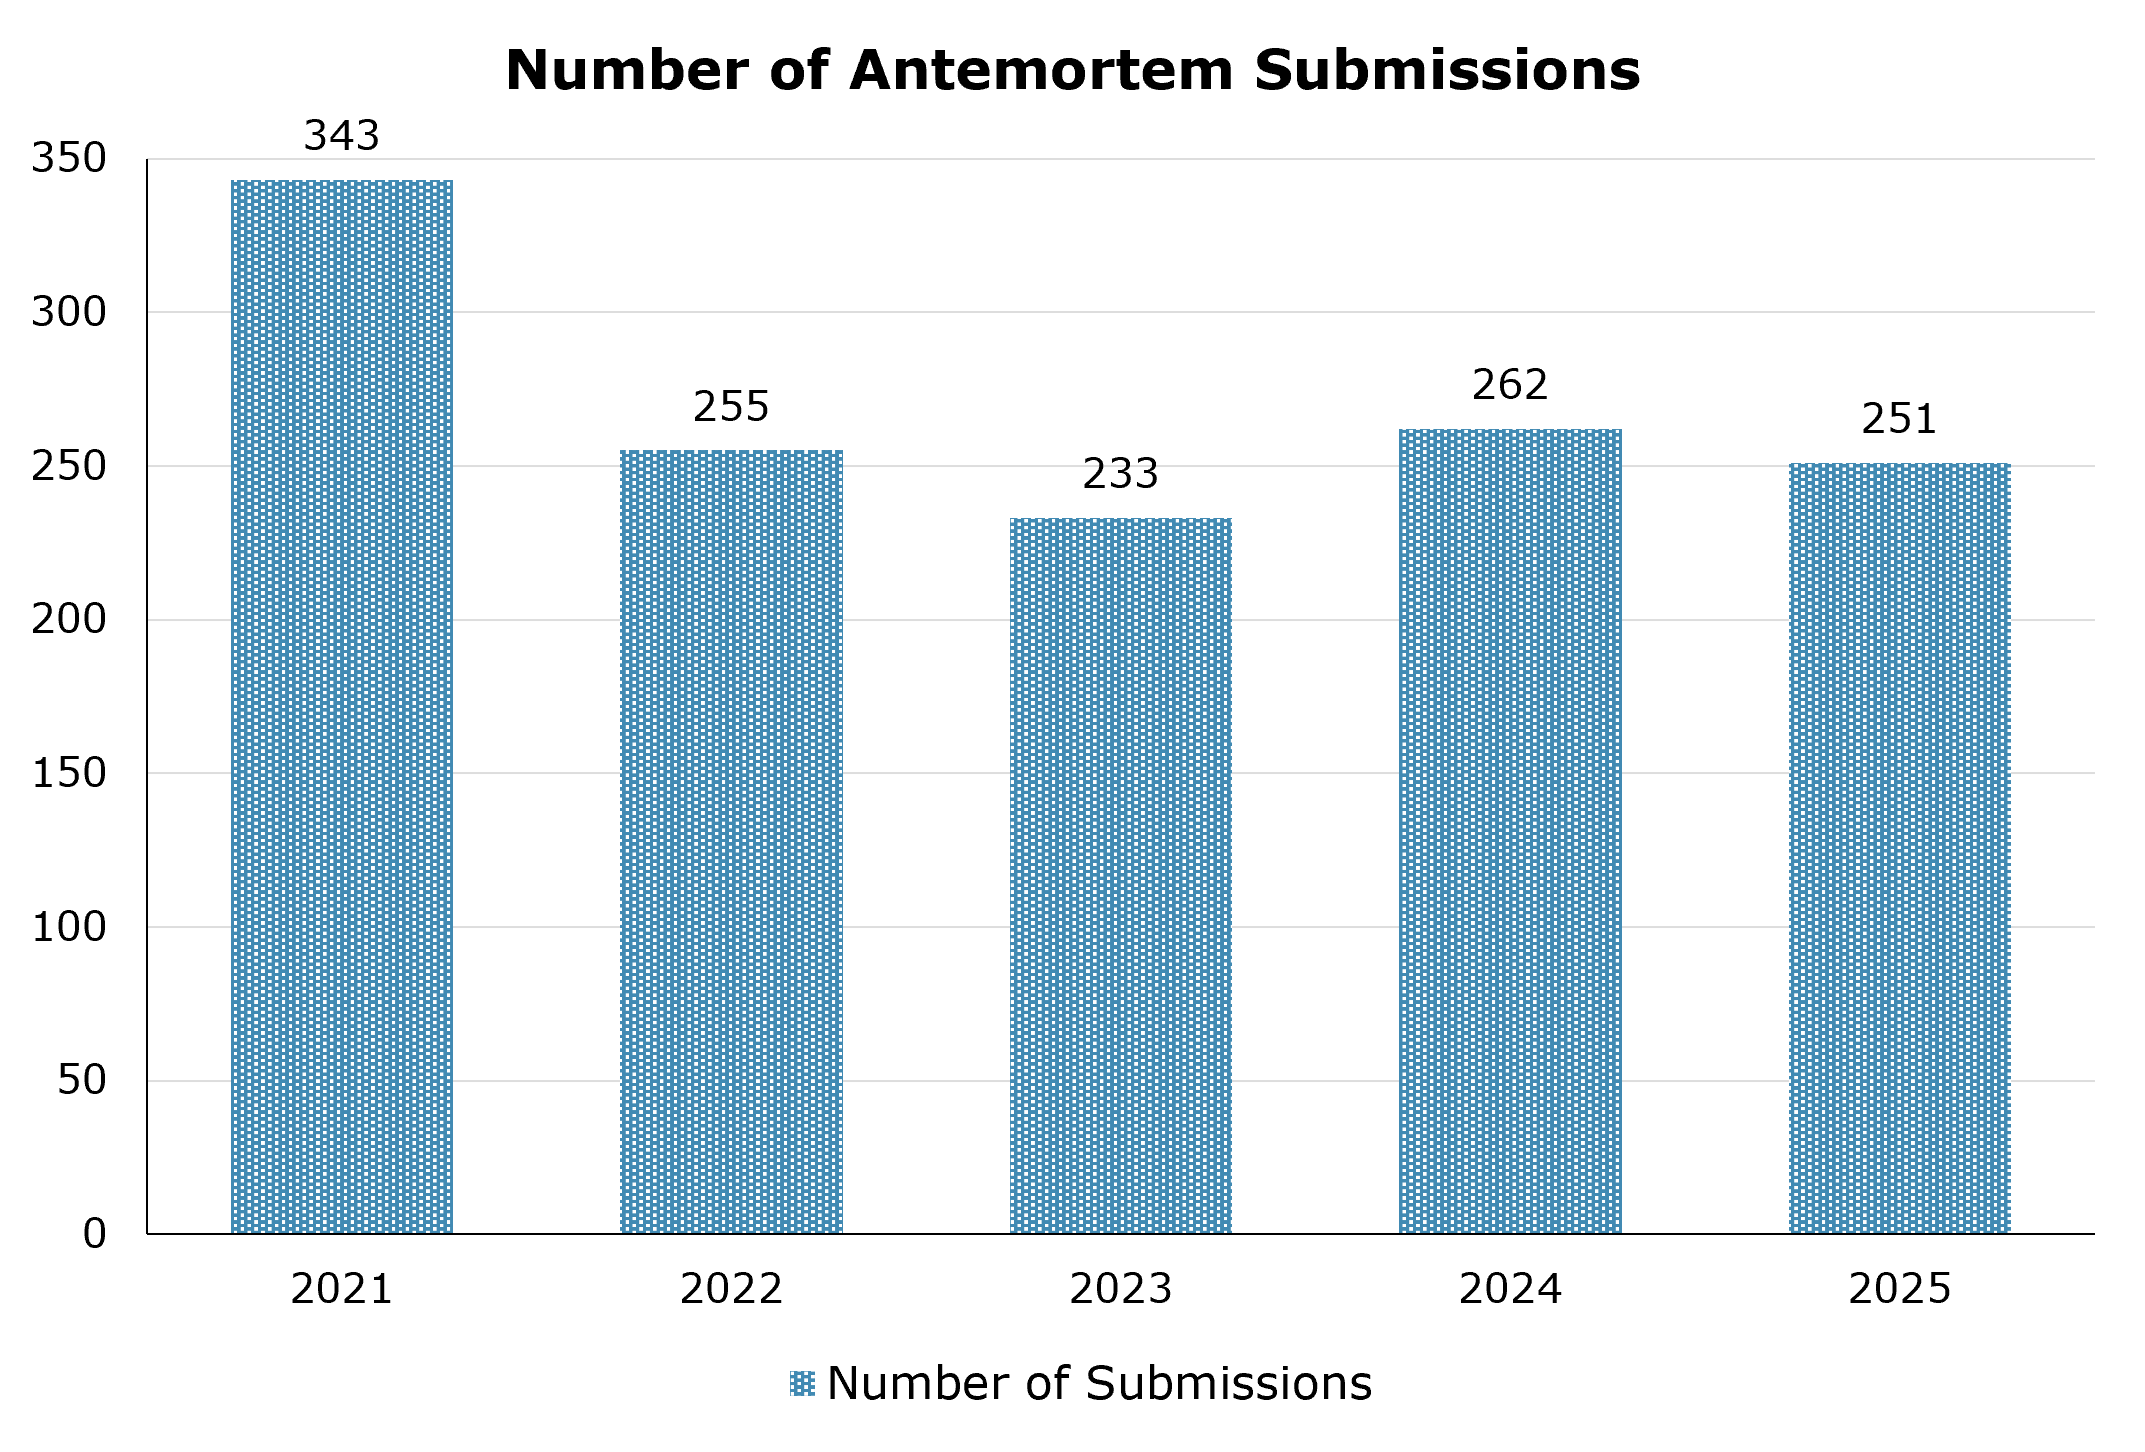
Figure 18 illustrates the number of new antemortem case submissions to the Toxicology Laboratory from 2021 through 2025. New antemortem submissions declined from 343 cases in 2021, decreased to 255 in 2022, decreased again to 233 in 2023, then increased to 262 in 2024, ending with 251 new case submissions in 2025.
| 2021 | 2022 | 2023 | 2024 | 2025 | |
|---|---|---|---|---|---|
| Number of Submissions | 343 | 255 | 233 | 262 | 251 |
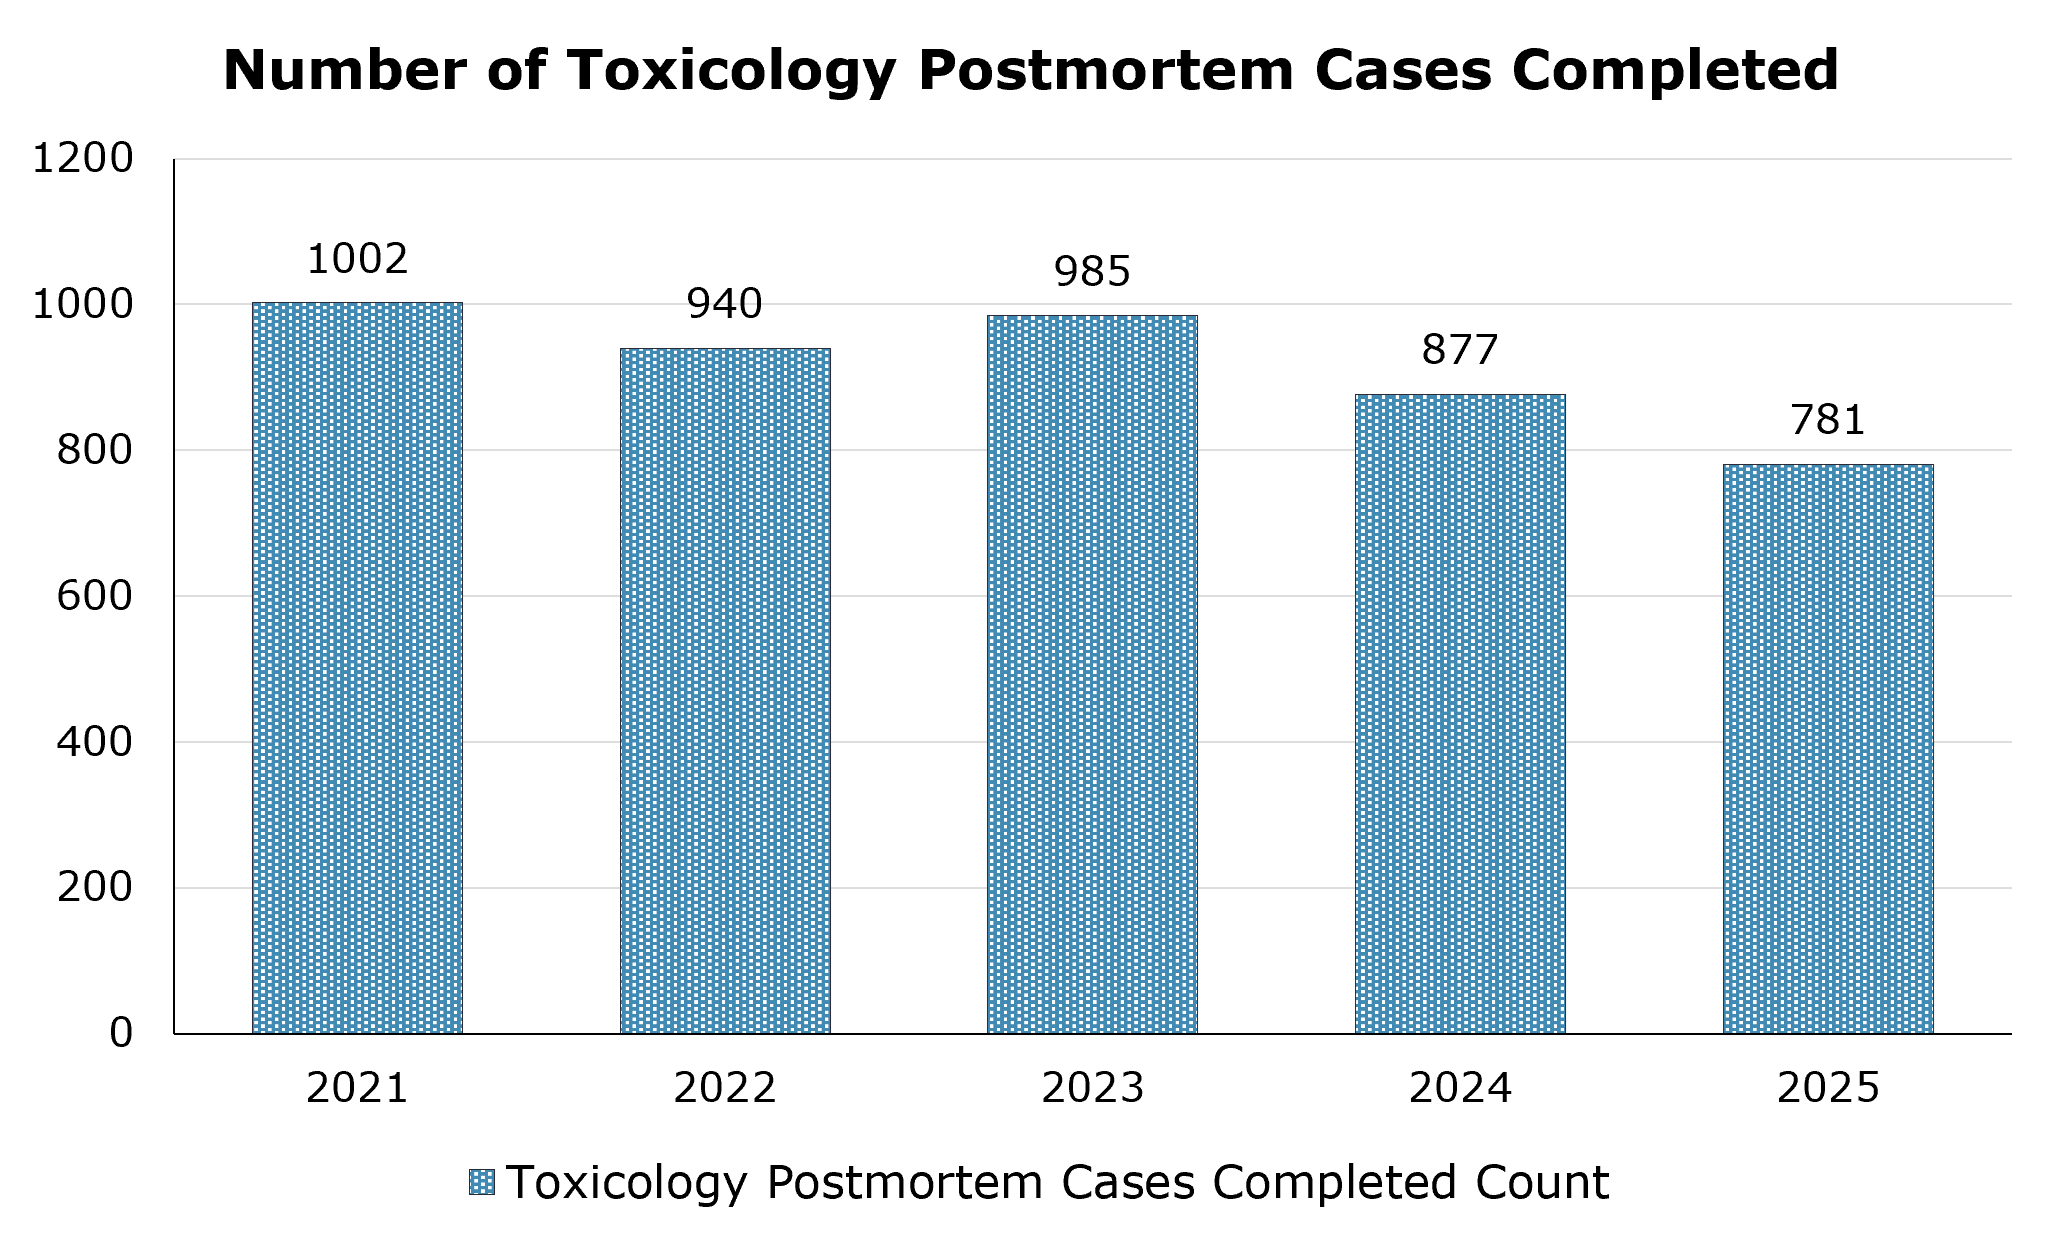
Figure 19 shows the number of postmortem cases completed by the Toxicology Laboratory from 2021 through 2025.
The number of cases completed show an overall downward trend from 2021 through 2025, despite a temporary increase in 2023.
- 2021: 1,002 cases — highest volume in the period.
- 2022: 940 cases — a decrease of 62 cases (6.2%).
- 2023: 985 cases — an increase of 45 cases (4.8%) from 2022, recovering much of the prior-year decline.
- 2024: 877 cases — a decrease of 108 cases (11.0%), the largest year-over-year reduction in the series.
- 2025: 781 cases — a further decrease of 96 cases (10.9%).
Across the full period, completed cases declined by 221 cases, from 1,002 in 2021 to 781 in 2025—an overall reduction of approximately 22.1%. The pattern suggests that the 2023 increase was not sustained; instead, the program experienced two consecutive and comparatively steep annual declines in 2024 and 2025.
| 2021 | 2022 | 2023 | 2024 | 2025 | |
|---|---|---|---|---|---|
| Number of Toxicology Postmortem Cases Completed | 1002 | 940 | 985 | 877 | 781 |
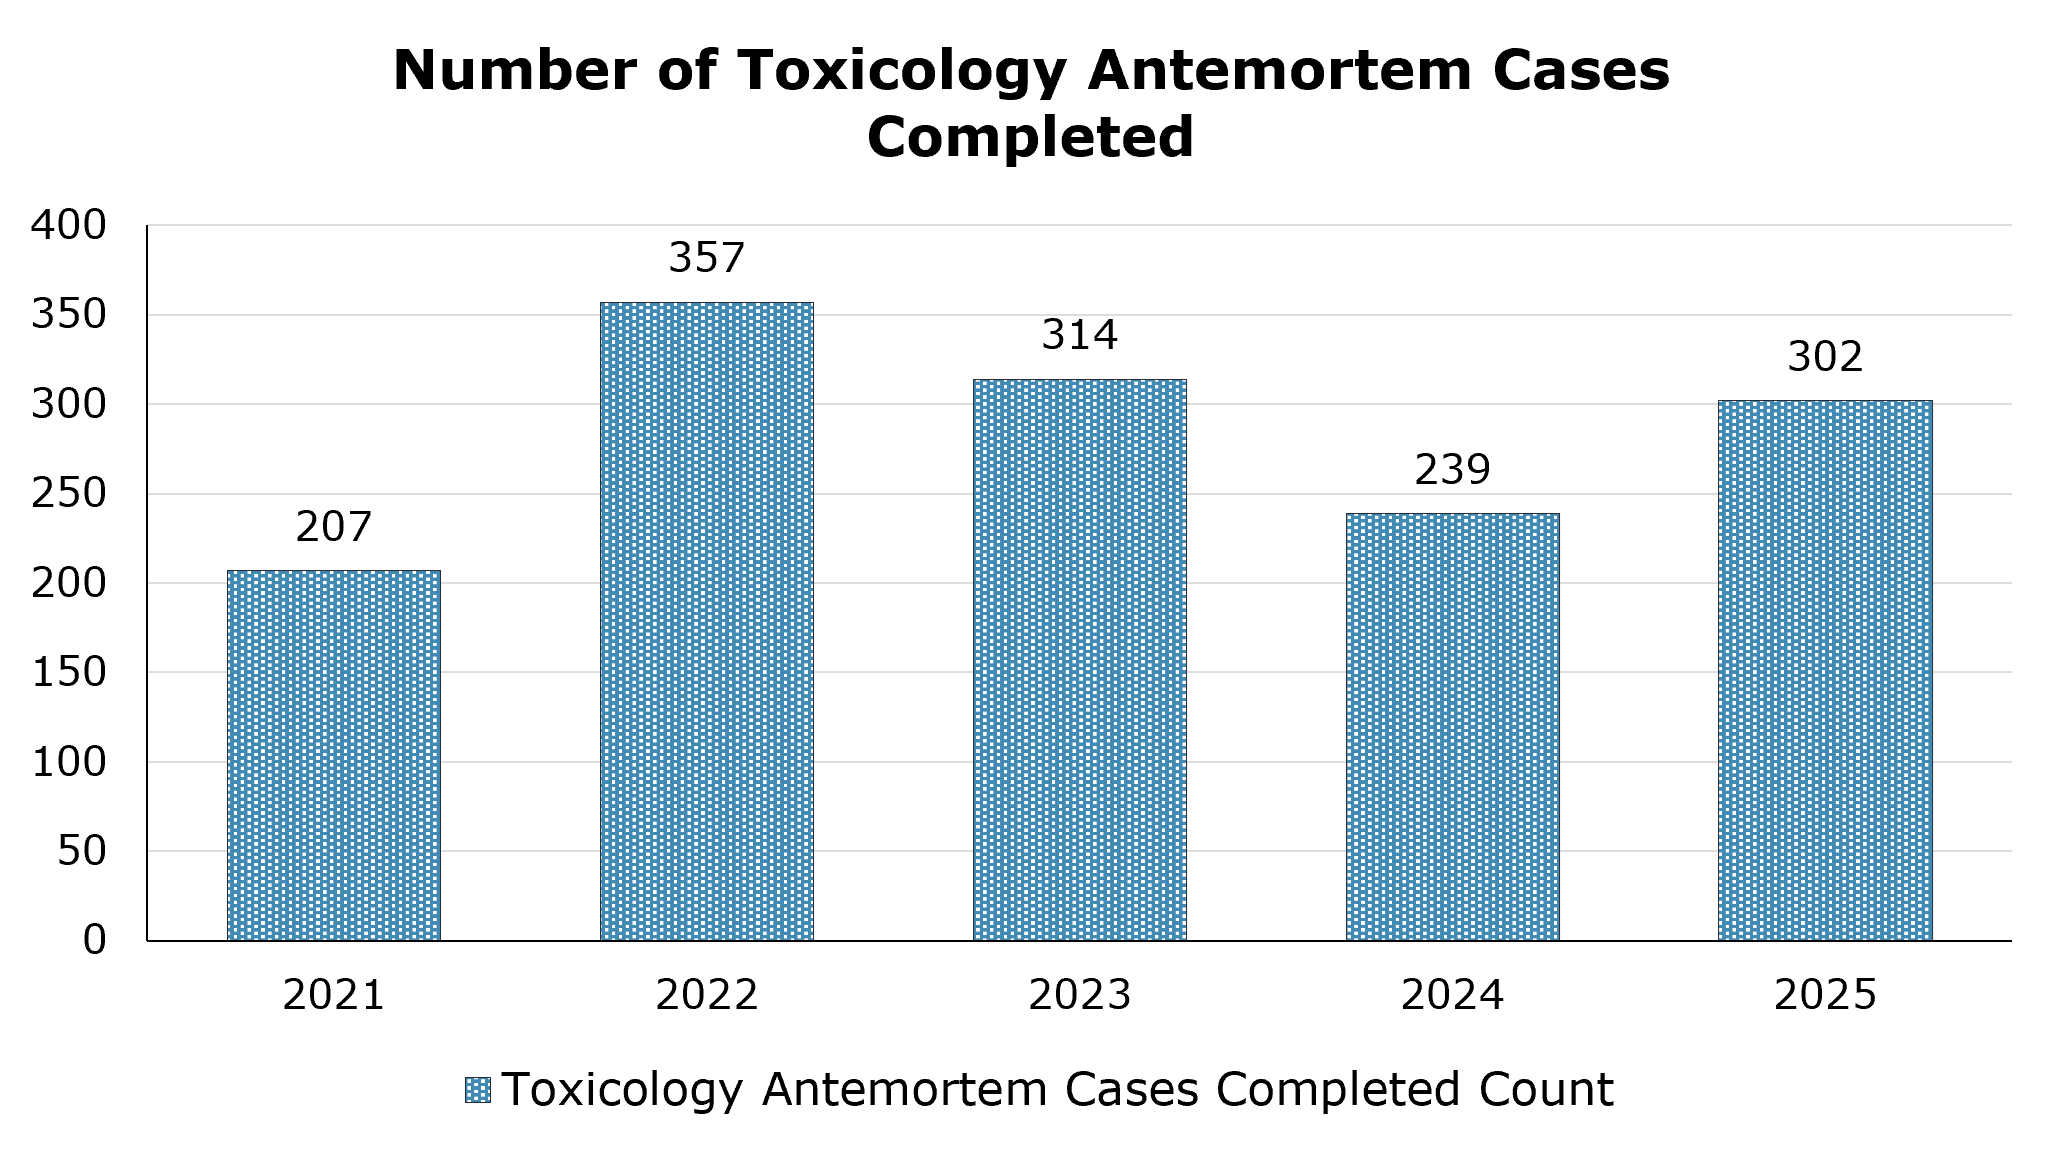
Figure 20 presents the number of Toxicology antemortem cases completed between 2021 and 2025. The number of cases completed increased sharply from 207 in 2021 to 357 in 2022, a rise of 150 cases (72.5%). Completion volume then declined for two consecutive years: to 314 in 2023 (12.0% decrease) and 239 in 2024 (23.9% decrease).
In 2025, completed cases rebounded to 302, an increase of 63 cases (26.4%) over 2024. While this recovery returned volume above the 2021 level by 95 cases (45.9%), 2025 remained 55 cases (15.4%) below the 2022 peak.
Overall, the five-year pattern shows substantial variability rather than a consistent upward or downward trend: a major surge in 2022, a two-year contraction through 2024, and a significant recovery in 2025.
| 2021 | 2022 | 2023 | 2024 | 2025 | |
|---|---|---|---|---|---|
| Number of Toxicology Antemortem Cases Completed | 207 | 357 | 314 | 239 | 302 |
Postmortem Drugs
Hundreds of different drugs can be analytically confirmed in Postmortem Toxicology cases, including a wide range of illicit, prescription, and over the counter drugs. New drugs are constantly emerging on the illicit drug market providing a challenge to the Toxicology Laboratory. Table 7 illustrates the most frequently confirmed drugs and/or metabolites in 2025 cases. Of the 797 cases submitted, there were a total of 141 different drugs and/or metabolites confirmed in 544 cases.
| Drugs Confirmed in Postmortem Cases | Case Count |
|---|---|
|
Methamphetamine |
173 |
|
Ethanol |
152 |
|
Amphetamine |
147 |
|
Fentanyl |
123 |
|
Norfentanyl |
100 |
|
Delta-9 THC |
97 |
|
Delta-9 Carboxy-THC |
88 |
|
4-ANPP |
61 |
|
Benzoylecgonine |
60 |
|
Naloxone |
58 |
|
Oxycodone |
30 |
|
Cocaine |
29 |
|
Delta-8 THC |
24 |
|
Gabapentin |
24 |
|
Amiodarone |
22 |
|
Diphenhydramine |
22 |
Drug-Related Deaths
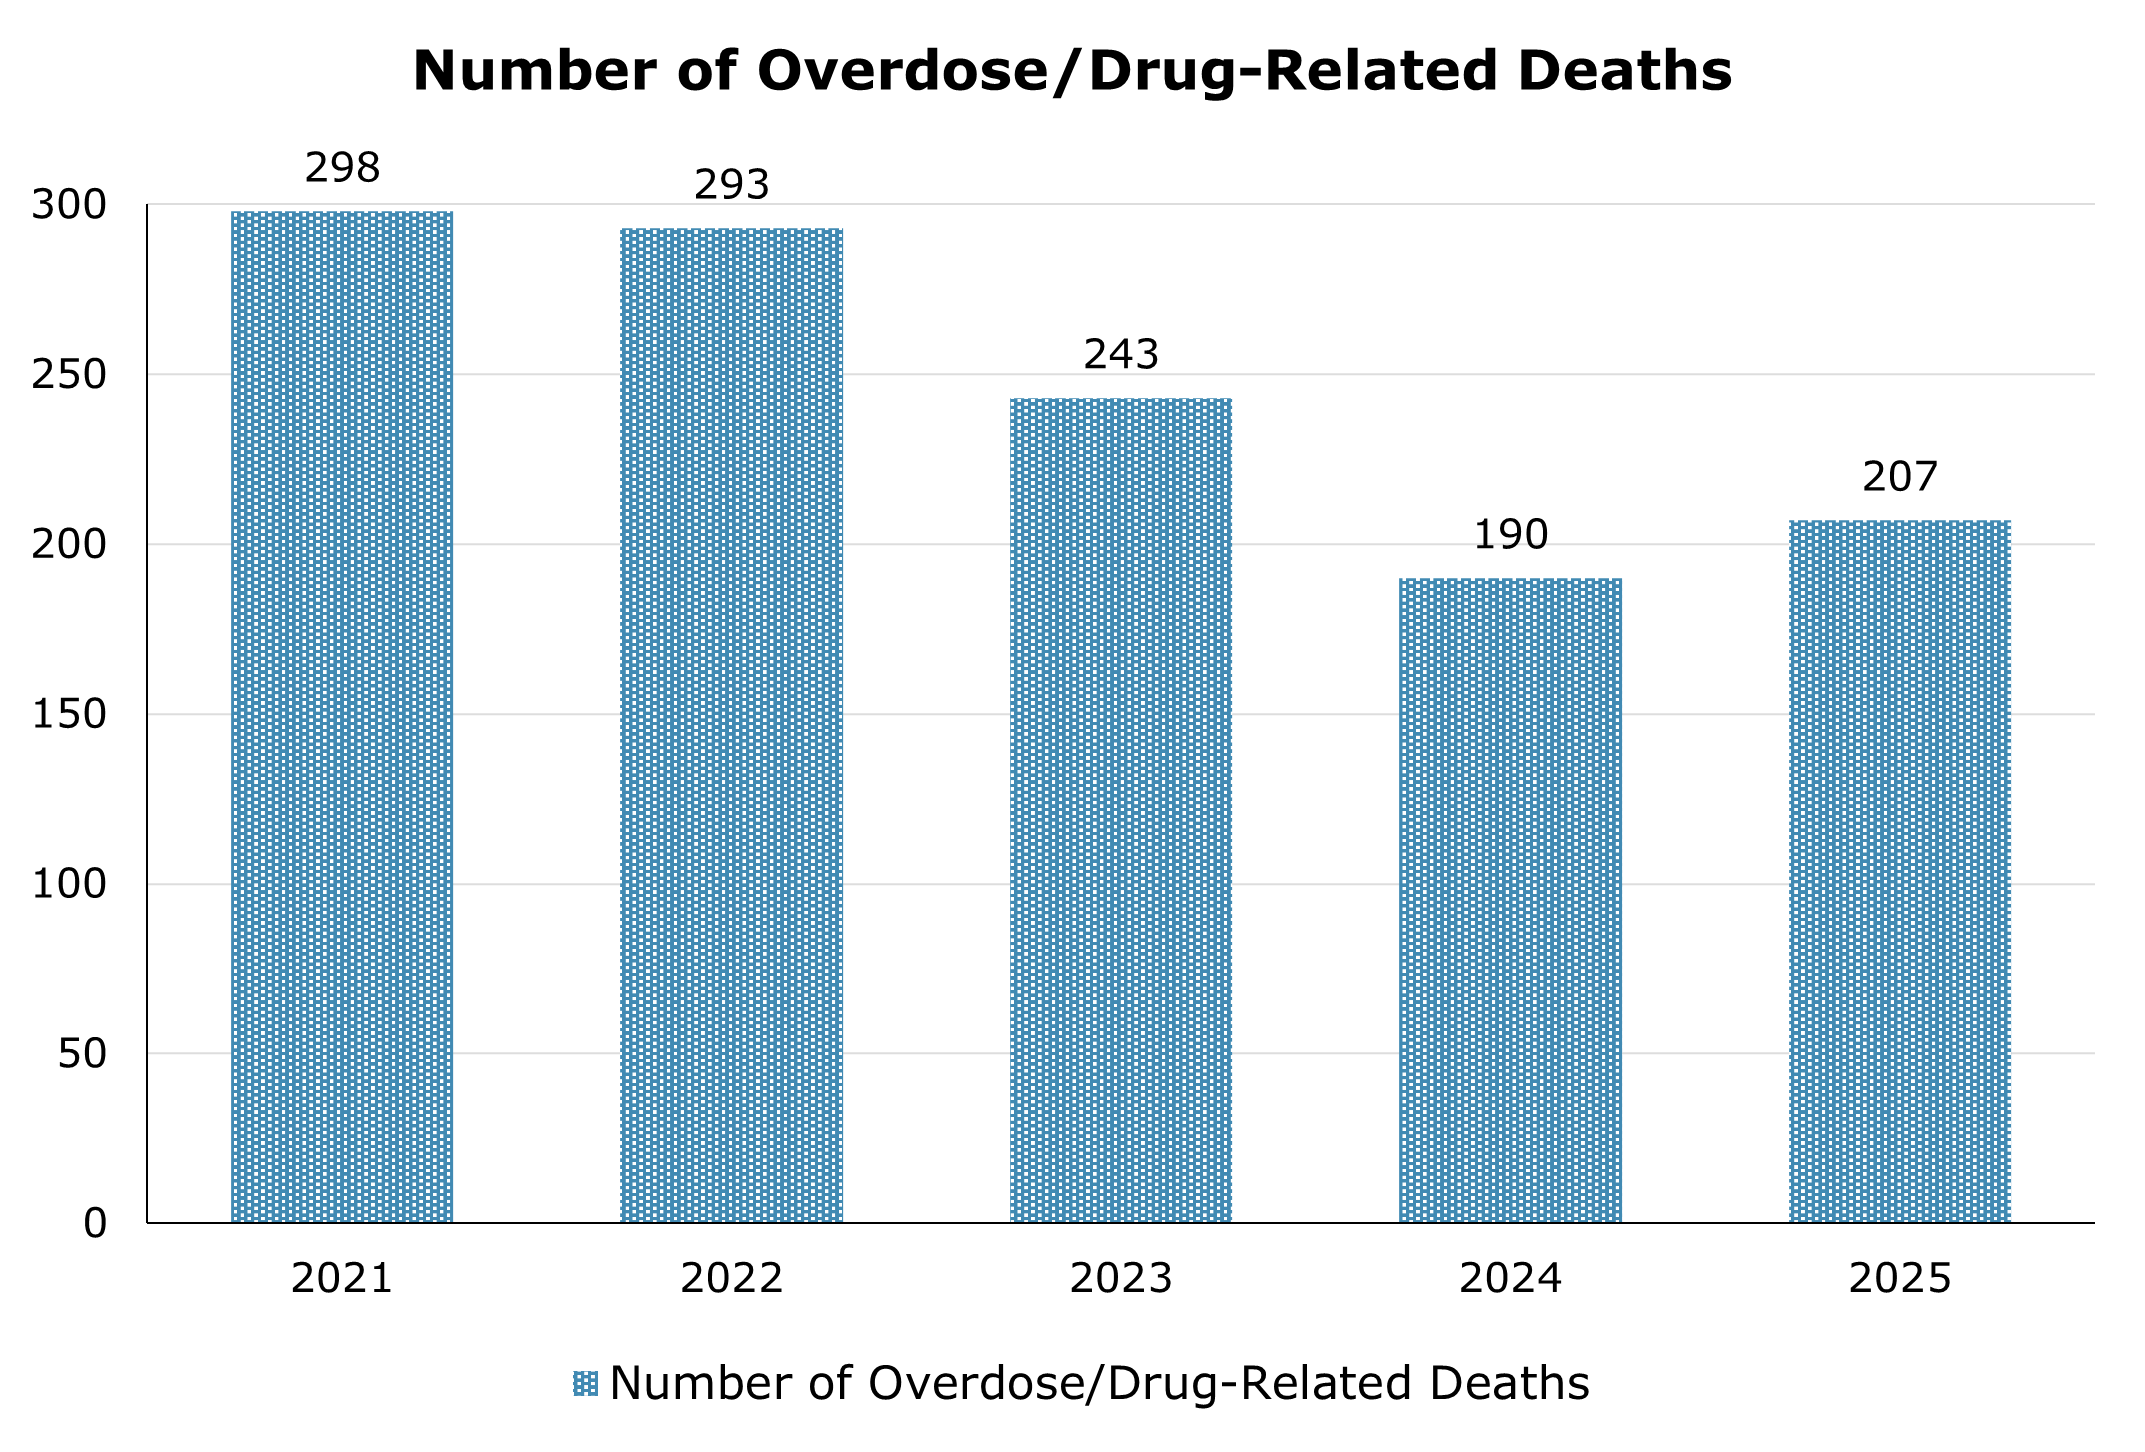
Drug-related deaths can be either accidental or intentional. Methamphetamine or opioids, including fentanyl, are frequently identified and analytically confirmed by the Toxicology Laboratory in biological specimens collected at autopsy. Figure 21 shows an overall downward trend in overdose/drug-related deaths from 2021 through 2025. The number of these deaths was 298 in 2021 and remained relatively consistent in 2022 at 293, before declining to 243 in 2023 and 190 in 2024. In 2025, the count increased slightly to 207.
| 2021 | 2022 | 2023 | 2024 | 2025 | |
|---|---|---|---|---|---|
| Number of Drug-Related Deaths | 298 | 293 | 243 | 190 | 207 |
Opioid Positive Drug-Related Deaths
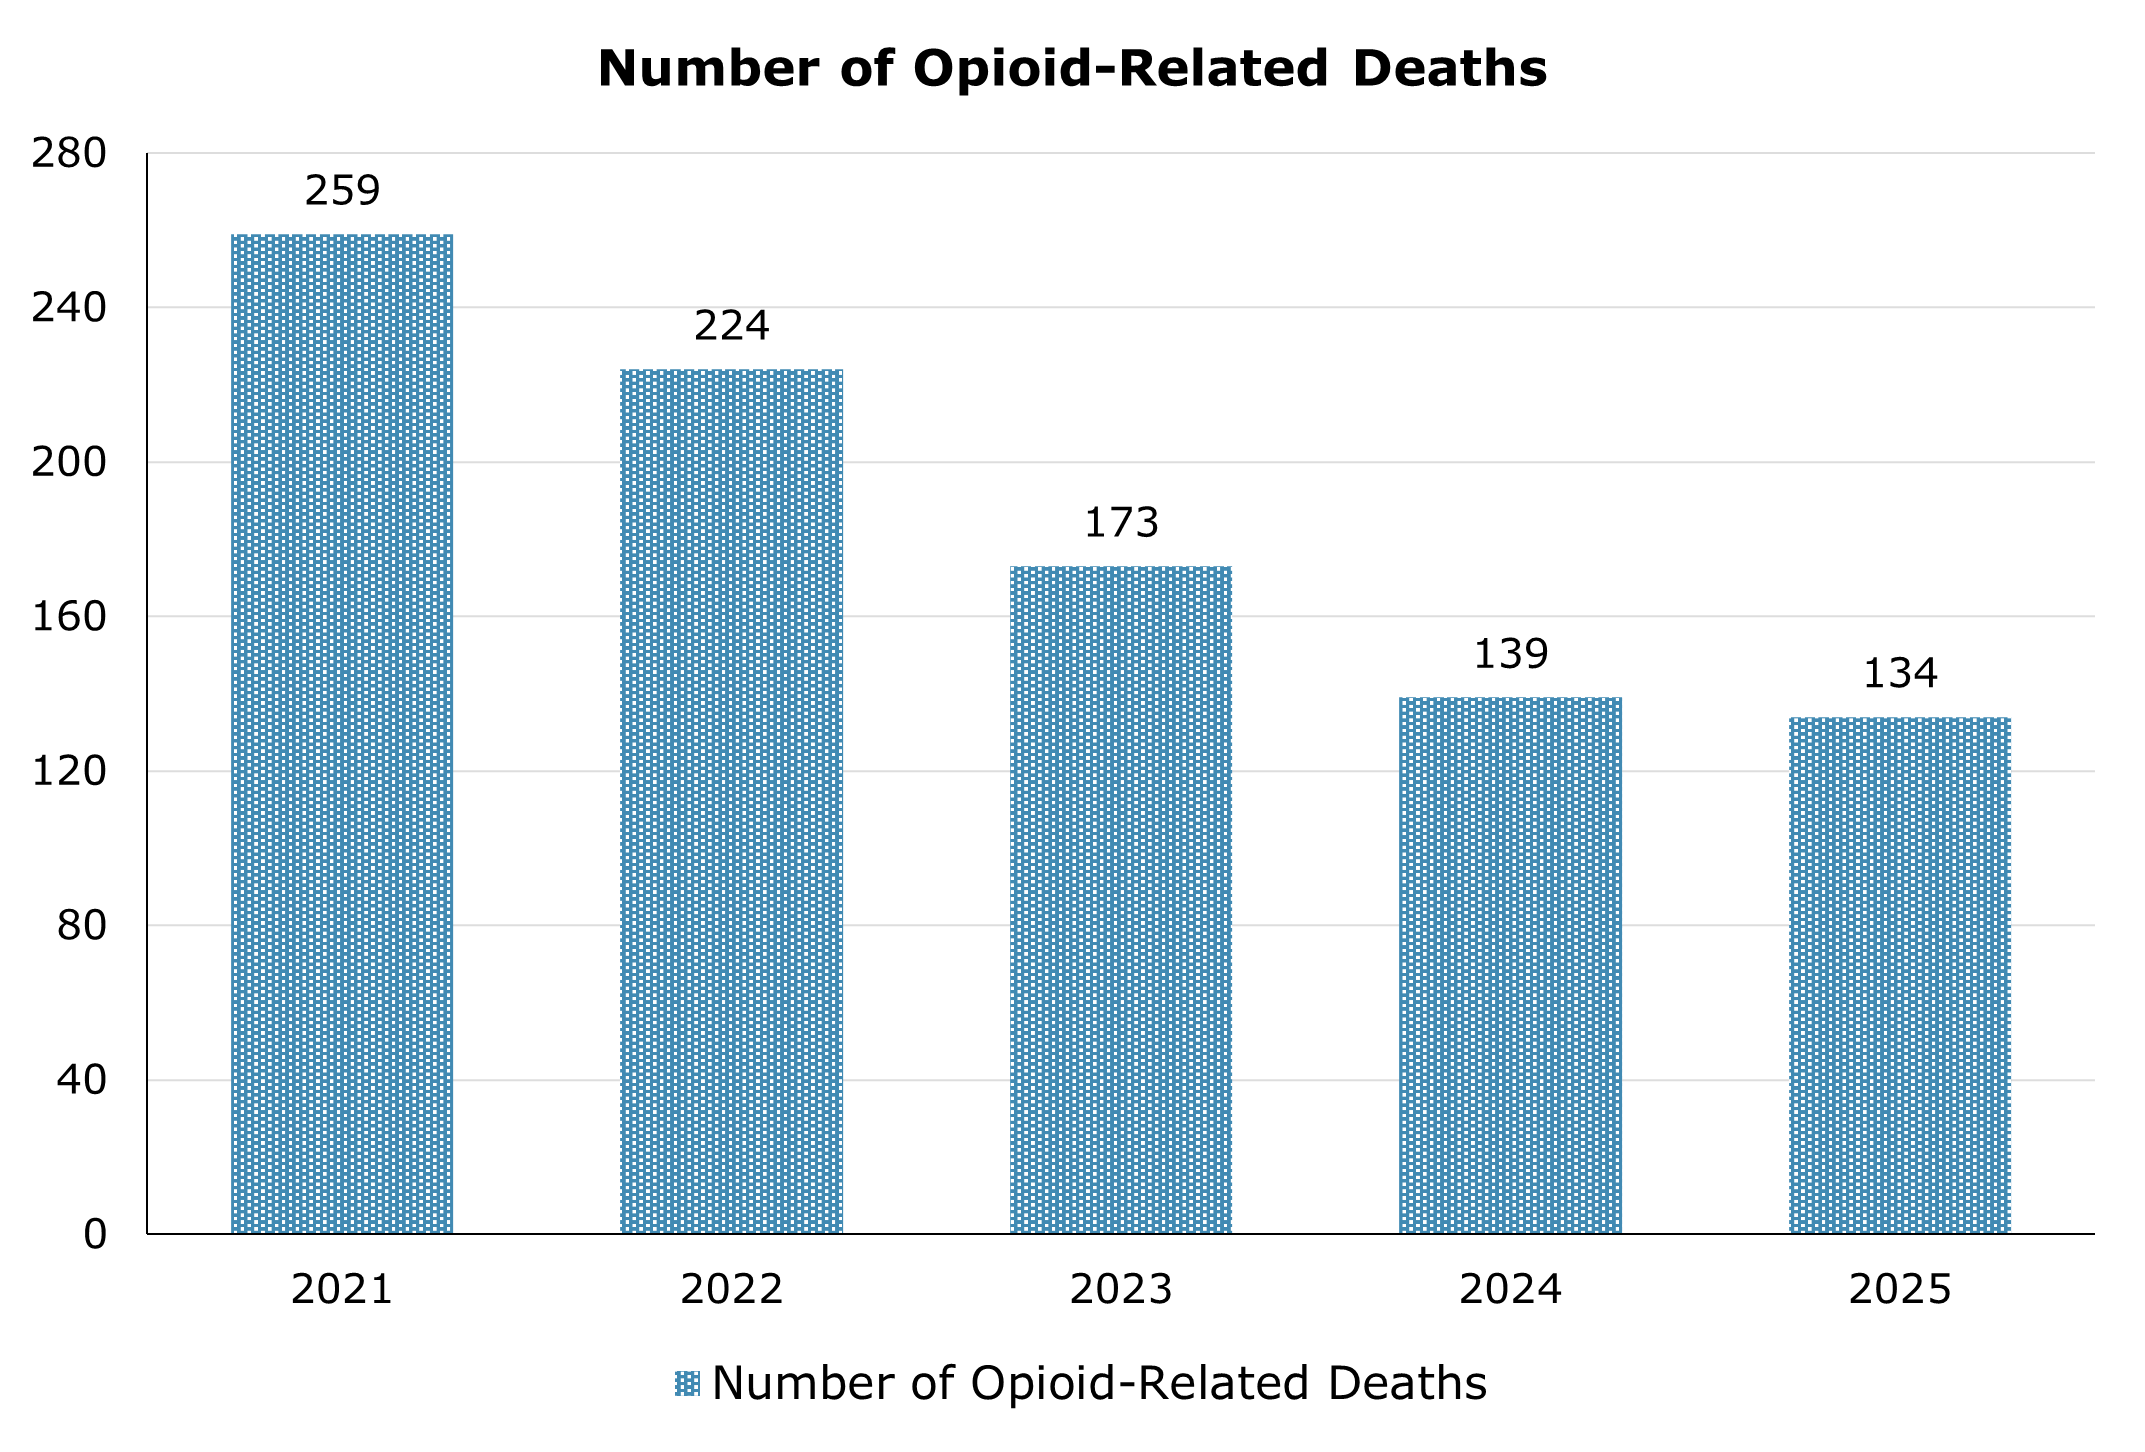
Figure 22 illustrates the number of drug-related deaths that tested positive for an opioid between 2021 and 2025. The data show a continued downward trend over this period, with 134 opioid-positive drug-related deaths in 2025, compared with 259 in 2021.
| 2021 | 2022 | 2023 | 2024 | 2025 | |
|---|---|---|---|---|---|
| Number of Opioid-Related Deaths | 259 | 224 | 173 | 139 | 134 |
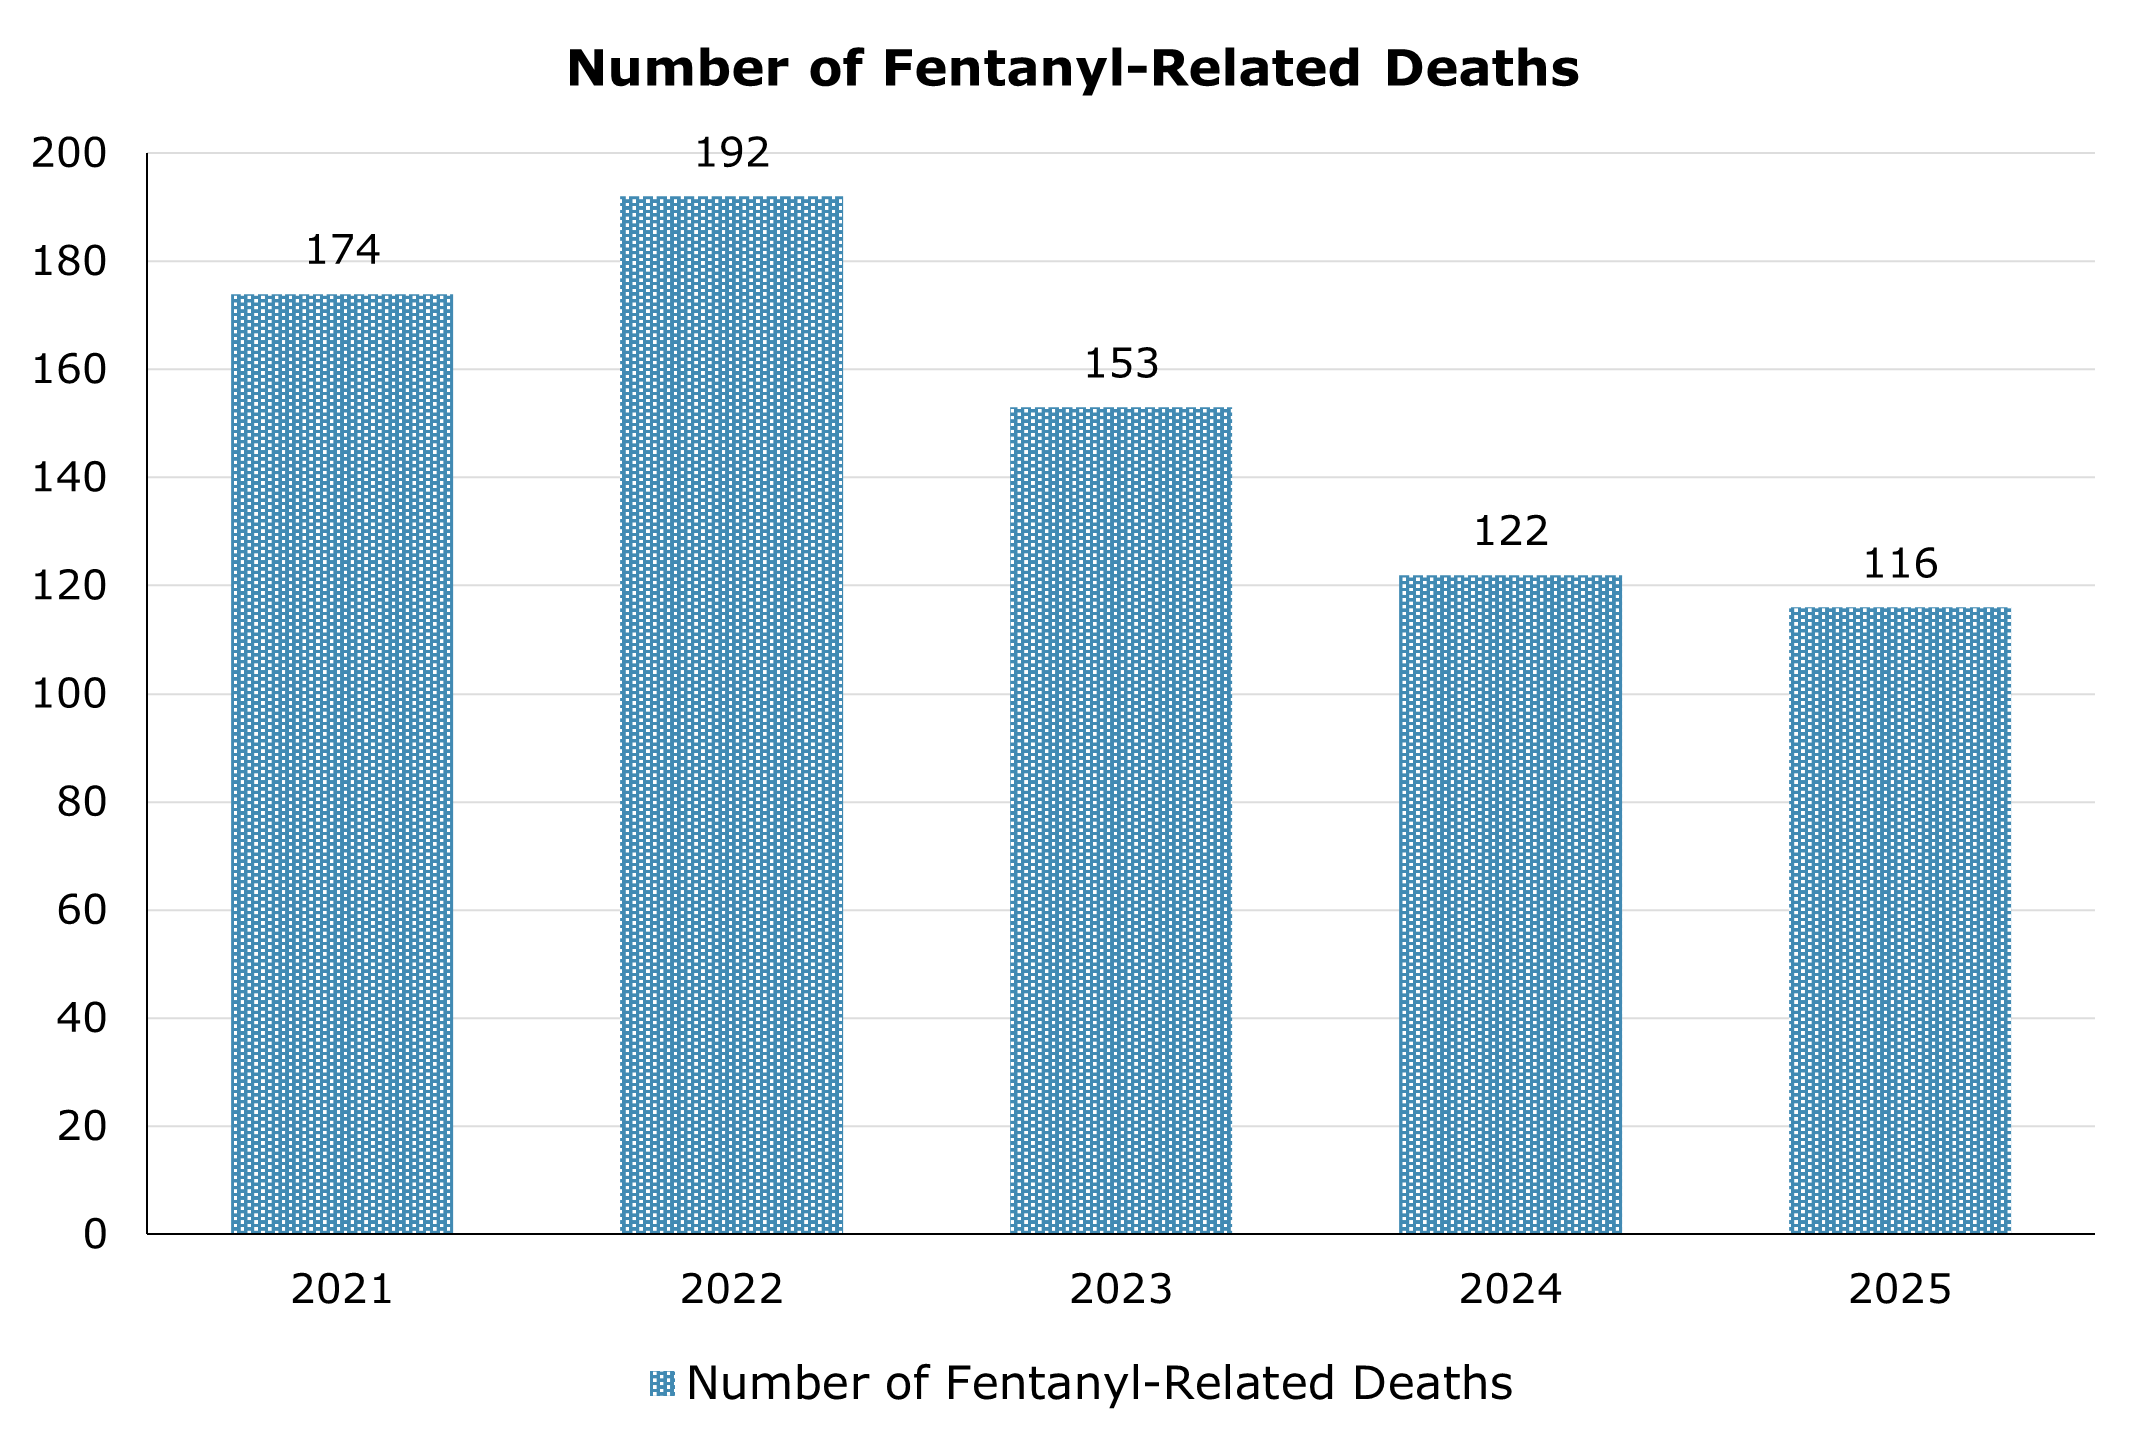
Figure 23 illustrates the number of fentanyl-related deaths between 2021 and 2025. Fentanyl remained the most frequently analytically confirmed opioid in postmortem cases. In 2025, there were 116 fentanyl-related deaths, reflecting a sustained decline from the peak of 192 in 2022.
| 2021 | 2022 | 2023 | 2024 | 2025 | |
|---|---|---|---|---|---|
| Number of Fentanyl-Related Deaths | 174 | 192 | 153 | 122 | 116 |
Methamphetamine Positive Drug-Related Deaths
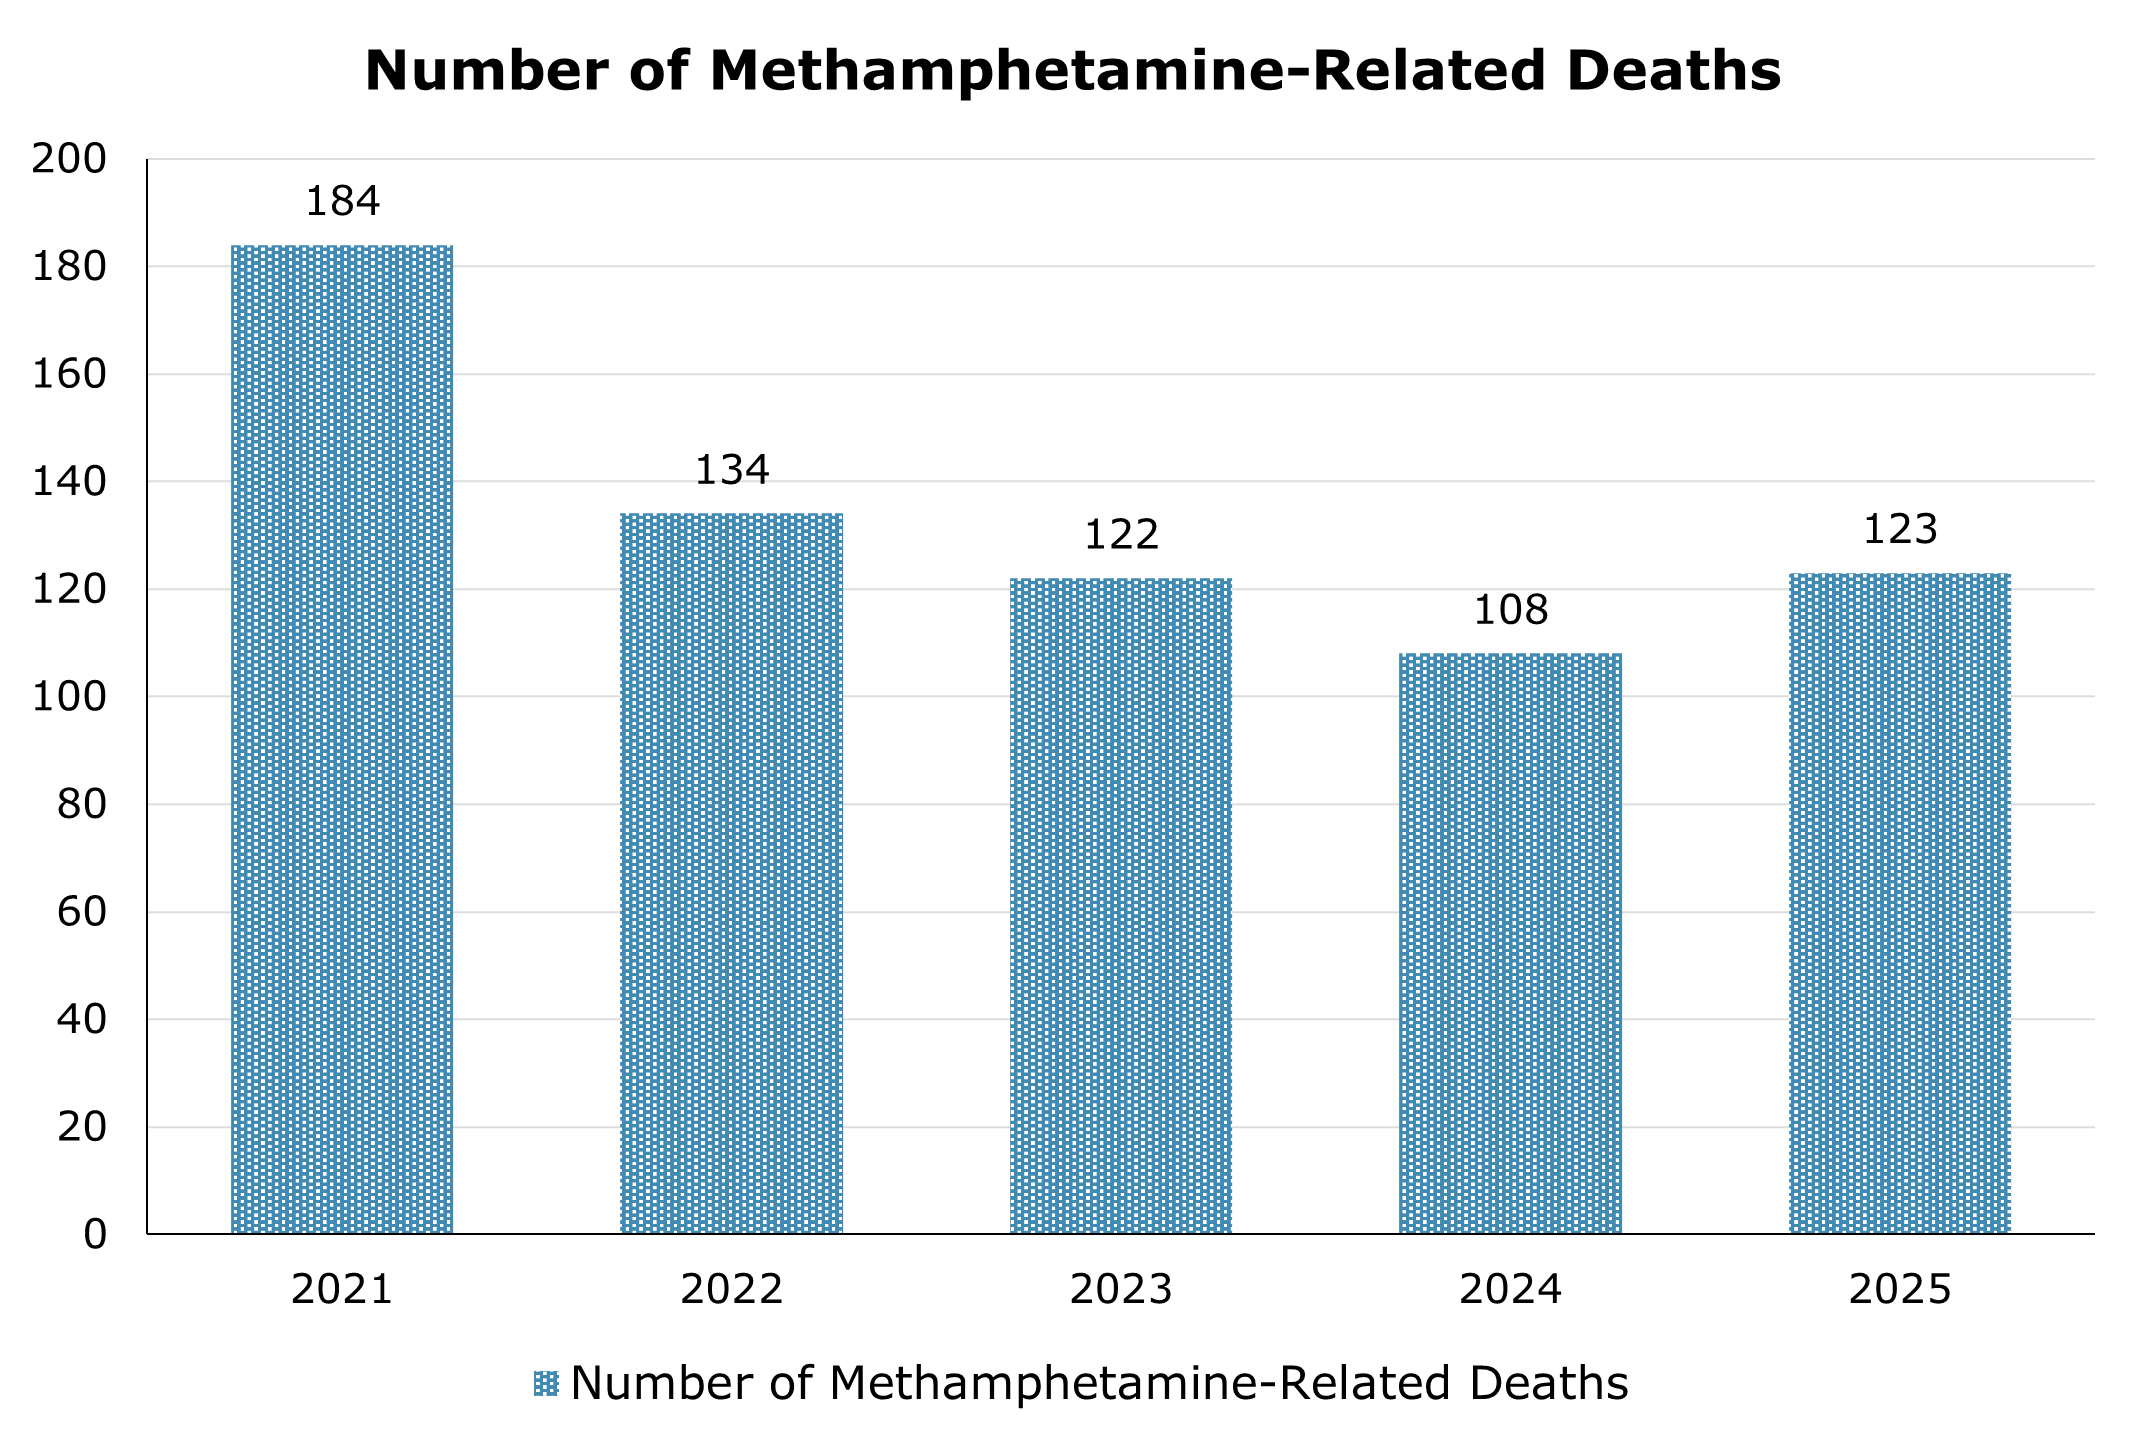
Decedent specimens that test positive for methamphetamine continue to be a significant portion of the drug-related deaths that occur. Figure 24 illustrates the number of drug-related deaths that tested positive for methamphetamine from 2021 through 2025. In 2025, 123 methamphetamine-positive drug-related deaths were recorded, reflecting an overall decline from the peak of 184 in 2021. However, the 2025 total represents an increase from 108 in 2024.
| 2021 | 2022 | 2023 | 2024 | 2025 | |
|---|---|---|---|---|---|
| Number of Methamphetamine-Related Deaths | 184 | 134 | 122 | 108 | 123 |
Drugs and Alcohol in Driving Cases
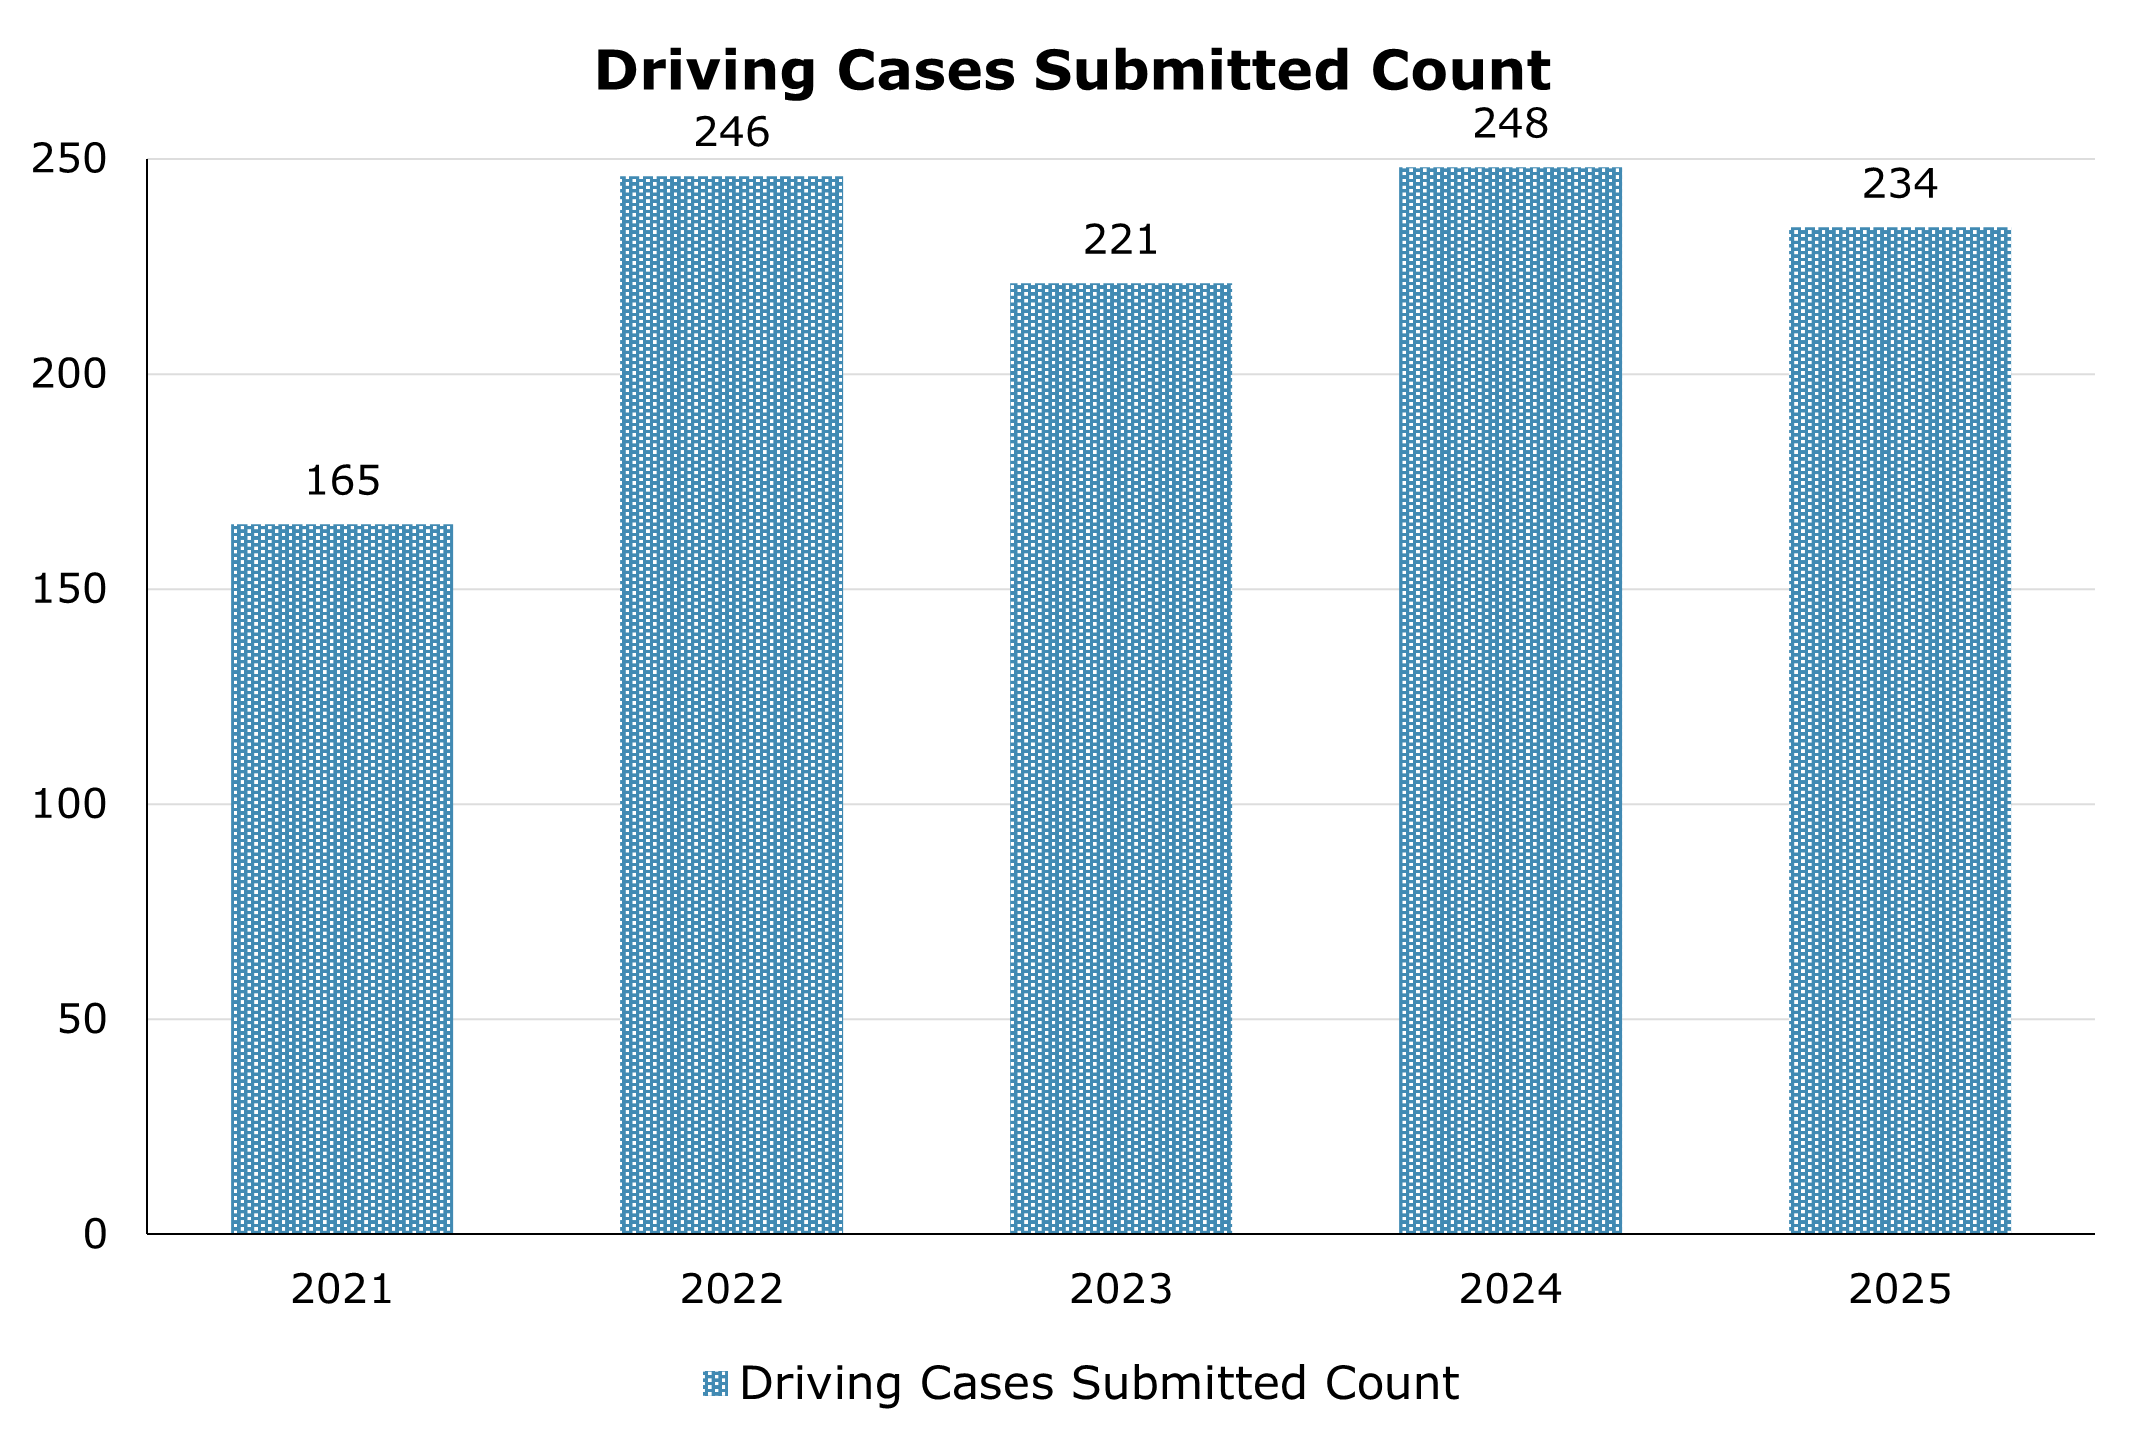
Many impairment investigations involve motorists under the influence of psychoactive drugs and/or ethanol. Analytical results summarized in Figure 25 and Table 8 reflect the toxicological findings from the 198 blood draw kits yielding positive results out of the 234 submitted in 2025. These cases encompass a range of driving-related offenses, including DUI/DUID, controlled-substance violations, vehicular homicide, vehicular fatality, police evasion, and hit-and-run incidents. Across all specimens, laboratory testing identified 44 distinct parent drugs, metabolites, and ethanol, yielding a total of 430 confirmed analytes, indicating substantial polysubstance involvement within the submitted case population.
| 2021 | 2022 | 2023 | 2024 | 2025 | |
|---|---|---|---|---|---|
| Driving Cases Submitted Count | 165 | 246 | 221 | 248 | 234 |
| Drugs Confirmed in Antemortem Driving Cases | 2021 | 2022 | 2023 | 2024 | 2025 |
|---|---|---|---|---|---|
|
11-Hydroxy-Delta-9-THC |
0 |
1 |
0 |
0 |
0 |
|
7-Aminoclonazepam |
6 |
5 |
5 |
2 |
6 |
|
9-hydroxyrisperidone |
0 |
0 |
0 |
1 |
0 |
|
a-Hydroxyalprazolam |
0 |
0 |
6 |
2 |
4 |
|
Alprazolam |
20 |
11 |
14 |
10 |
11 |
|
Amphetamine |
40 |
41 |
45 |
35 |
28 |
|
Aripiprazole |
0 |
0 |
0 |
1 |
0 |
|
Benzoylecgonine |
21 |
13 |
9 |
16 |
11 |
|
Bromazolam |
1 |
1 |
3 |
8 |
4 |
|
Butalbital |
1 |
2 |
0 |
0 |
0 |
|
Cannabidiol [CBD] |
0 |
0 |
3 |
0 |
0 |
|
Carbamazepine |
0 |
0 |
0 |
0 |
1 |
|
Carbamazepine-10, 11-epoxide |
0 |
0 |
0 |
0 |
1 |
|
Carboxytetrahydrocannabinol^ |
0 |
0 |
0 |
1 |
0 |
|
Carisoprodol |
3 |
2 |
1 |
1 |
0 |
|
Clonazepam |
5 |
3 |
5 |
2 |
6 |
|
Cocaethylene |
0 |
1 |
3 |
2 |
2 |
|
Cocaine |
3 |
5 |
5 |
4 |
3 |
|
Codeine |
2 |
1 |
0 |
0 |
0 |
|
Cyclobenzaprine |
0 |
0 |
0 |
0 |
1 |
|
Delta-8-Carboxy-THC^ |
0 |
5 |
16 |
19 |
19 |
|
Delta-8-THC^ |
0 |
3 |
11 |
12 |
10 |
|
Delta-9-Carboxy-THC^ |
0 |
16 |
71 |
68 |
54 |
|
Delta-9-THC^ |
0 |
13 |
70 |
60 |
53 |
|
Dextro/Levomethorphan |
0 |
0 |
0 |
0 |
1 |
|
Dextrophan/Levorphanol |
0 |
0 |
0 |
0 |
1 |
|
Diazepam |
6 |
0 |
2 |
5 |
1 |
|
Difluoroethane |
1 |
2 |
1 |
1 |
0 |
|
Diphenhydramine |
0 |
0 |
0 |
0 |
1 |
|
EDDP |
0 |
0 |
4 |
5 |
7 |
|
Ephedrine |
0 |
0 |
0 |
1 |
0 |
|
Es/Citalopram |
0 |
0 |
0 |
2 |
0 |
|
Ethanol |
125 |
69 |
81 |
100 |
92 |
|
Etizolam |
0 |
0 |
0 |
0 |
0 |
|
Fentanyl |
57 |
33 |
30 |
13 |
20 |
|
Flualprazolam |
0 |
0 |
0 |
0 |
0 |
|
Flubromazepam |
0 |
0 |
0 |
0 |
0 |
|
Flubromazolam |
0 |
0 |
0 |
0 |
0 |
|
Fluoxetine |
1 |
0 |
0 |
0 |
0 |
|
Gabapentin |
2 |
0 |
0 |
1 |
1 |
|
Hydrocodone |
5 |
10 |
2 |
1 |
1 |
|
Hydromorphone |
1 |
0 |
2 |
0 |
0 |
|
Hydroxybupropion |
0 |
0 |
0 |
1 |
1 |
|
Ketamine |
0 |
0 |
0 |
0 |
1 |
|
Lamotrigine |
1 |
0 |
0 |
0 |
0 |
|
Lorazepam |
2 |
4 |
1 |
2 |
3 |
|
Meprobamate |
5 |
2 |
1 |
2 |
0 |
|
Methadone |
13 |
9 |
5 |
6 |
8 |
|
Methamphetamine |
60 |
52 |
50 |
46 |
38 |
|
Methylenedioxyamphetamine |
1 |
0 |
0 |
0 |
0 |
|
Methylenedioxymethamphetamine |
2 |
0 |
0 |
1 |
0 |
|
Midazolam |
0 |
0 |
1 |
1 |
0 |
|
Mitragynine |
0 |
0 |
0 |
2 |
3 |
|
Morphine |
6 |
1 |
1 |
1 |
0 |
|
Naloxone |
0 |
0 |
0 |
0 |
1 |
|
Nordiazepam |
7 |
0 |
2 |
4 |
1 |
|
Nordiphenhydramine |
0 |
0 |
0 |
1 |
1 |
|
Norfentanyl |
49 |
30 |
28 |
12 |
17 |
|
Norfluoxetine |
1 |
0 |
0 |
0 |
0 |
|
Norketamine |
0 |
0 |
0 |
0 |
1 |
|
O-Desmethyltramadol |
0 |
0 |
1 |
0 |
0 |
|
Olanzapine |
0 |
0 |
0 |
0 |
1 |
|
Oxazepam |
0 |
0 |
0 |
1 |
0 |
|
Oxycodone |
9 |
2 |
5 |
2 |
3 |
|
Oxymorphone |
0 |
0 |
0 |
0 |
0 |
|
Phenazepam |
0 |
0 |
0 |
1 |
0 |
|
Phencyclidine |
5 |
1 |
2 |
4 |
1 |
|
Phenobarbital |
0 |
1 |
1 |
0 |
0 |
|
Pregabalin |
0 |
0 |
0 |
0 |
1 |
|
Sertraline |
0 |
0 |
0 |
0 |
0 |
|
Temazepam |
1 |
0 |
1 |
1 |
0 |
|
Tetrahydrocannabinol (THC) |
84 |
49 |
0 |
0 |
0 |
|
Topiramate |
0 |
0 |
0 |
0 |
1 |
|
Tramadol |
0 |
0 |
1 |
0 |
0 |
|
Trazodone |
1 |
0 |
0 |
1 |
0 |
|
Venlafaxine |
0 |
0 |
0 |
0 |
1 |
|
Xylazine |
0 |
0 |
0 |
1 |
2 |
|
Zolpidem |
3 |
5 |
8 |
6 |
6 |
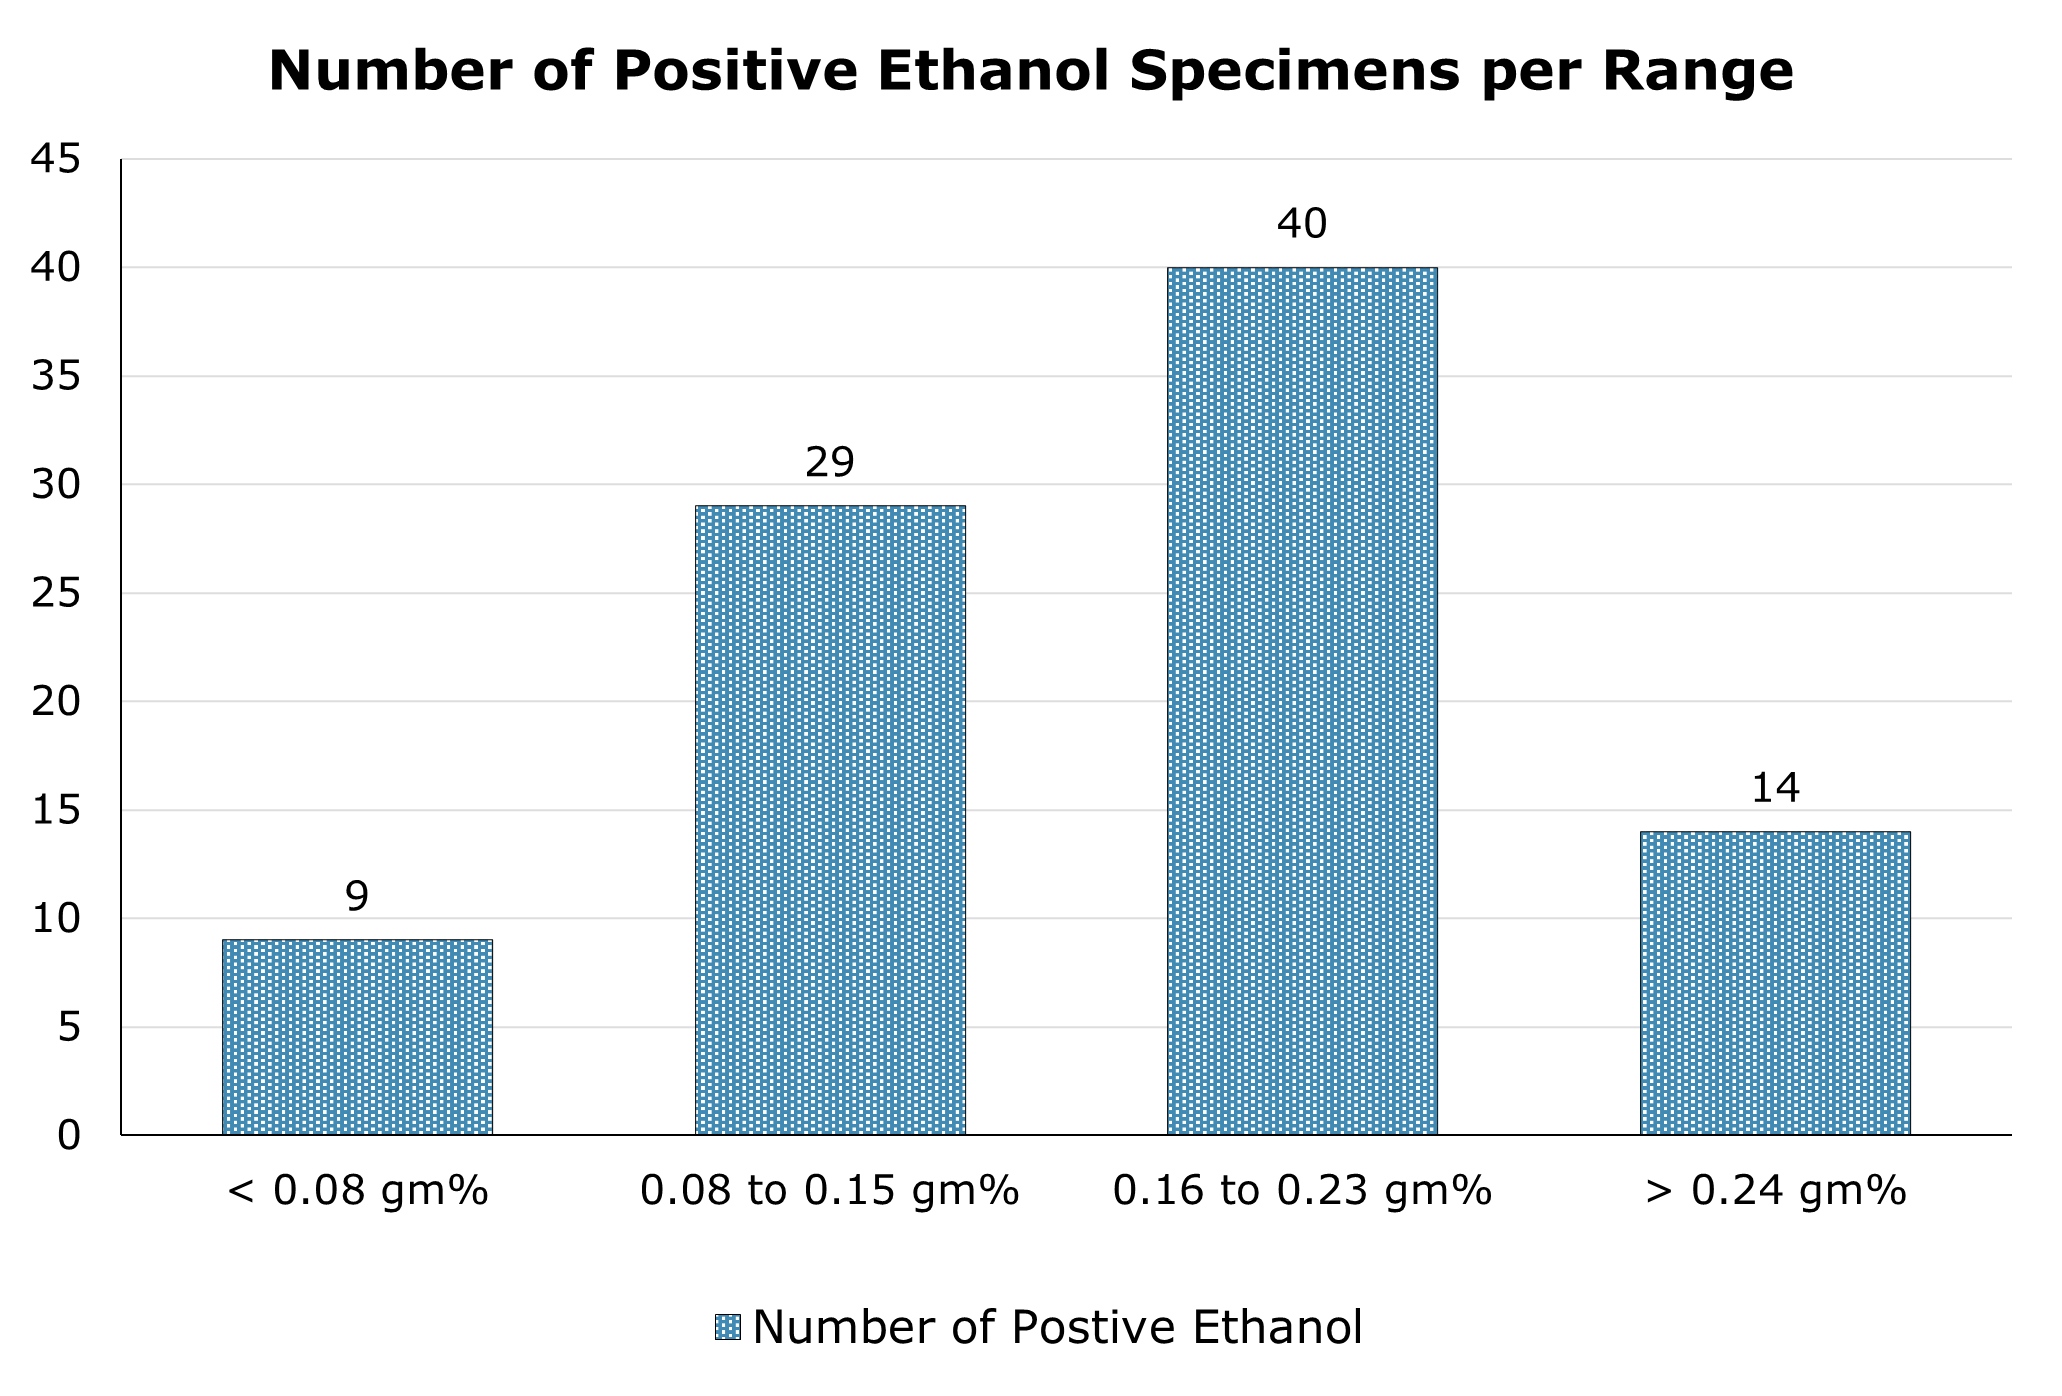
Figure 26 illustrates the distribution of positive ethanol results in postmortem driving cases across s four concentration ranges: less than 0.08 gm%, 0.08–0.15 gm%, 0.16–0.23 gm%, and greater than 0.24 gm%. The greatest number of positive findings occurred in the 0.16–0.23 gm% range, with 40 specimens. This was followed by 29 specimens in the 0.08–0.15 gm% range, 9 specimens below 0.08 gm%, and 14 specimens above 0.24 gm%. Overall, the distribution shows that most ethanol-positive specimens were above the legal threshold for impairment. The highest ethanol concentration quantified in a specimen was 0.333 gm%.
| Less Than 0.08 gm% | 0.08 to 0.15 gm% | 0.16 to 0.23 gm% | Greater Than 0.24 gm% | |
|---|---|---|---|---|
| Number of Positives | 9 | 29 | 40 | 14 |
Drug-Facilitated Sexual Assaults
Drug-facilitated sexual assaults (DFSA) represent a particularly complex category of forensic toxicology casework. These investigations may involve either the covert administration of a pharmacologically active substance by a perpetrator or the voluntary ingestion of such a substance by a victim. In either circumstance, the substance may impair the victim through sedation, incapacitation, or anterograde amnesia, thereby facilitating the commission of a sexual assault.
DFSA case specimens frequently contain multiple drugs, drug metabolites, and/or ethanol. Among the 14 cases submitted in 2025, 13 yielded positive results. Laboratory analysis identified 33 distinct analytes, accounting for 65 total positive drug confirmations across all cases and reflecting the polysubstance patterns commonly observed in DFSA toxicology.
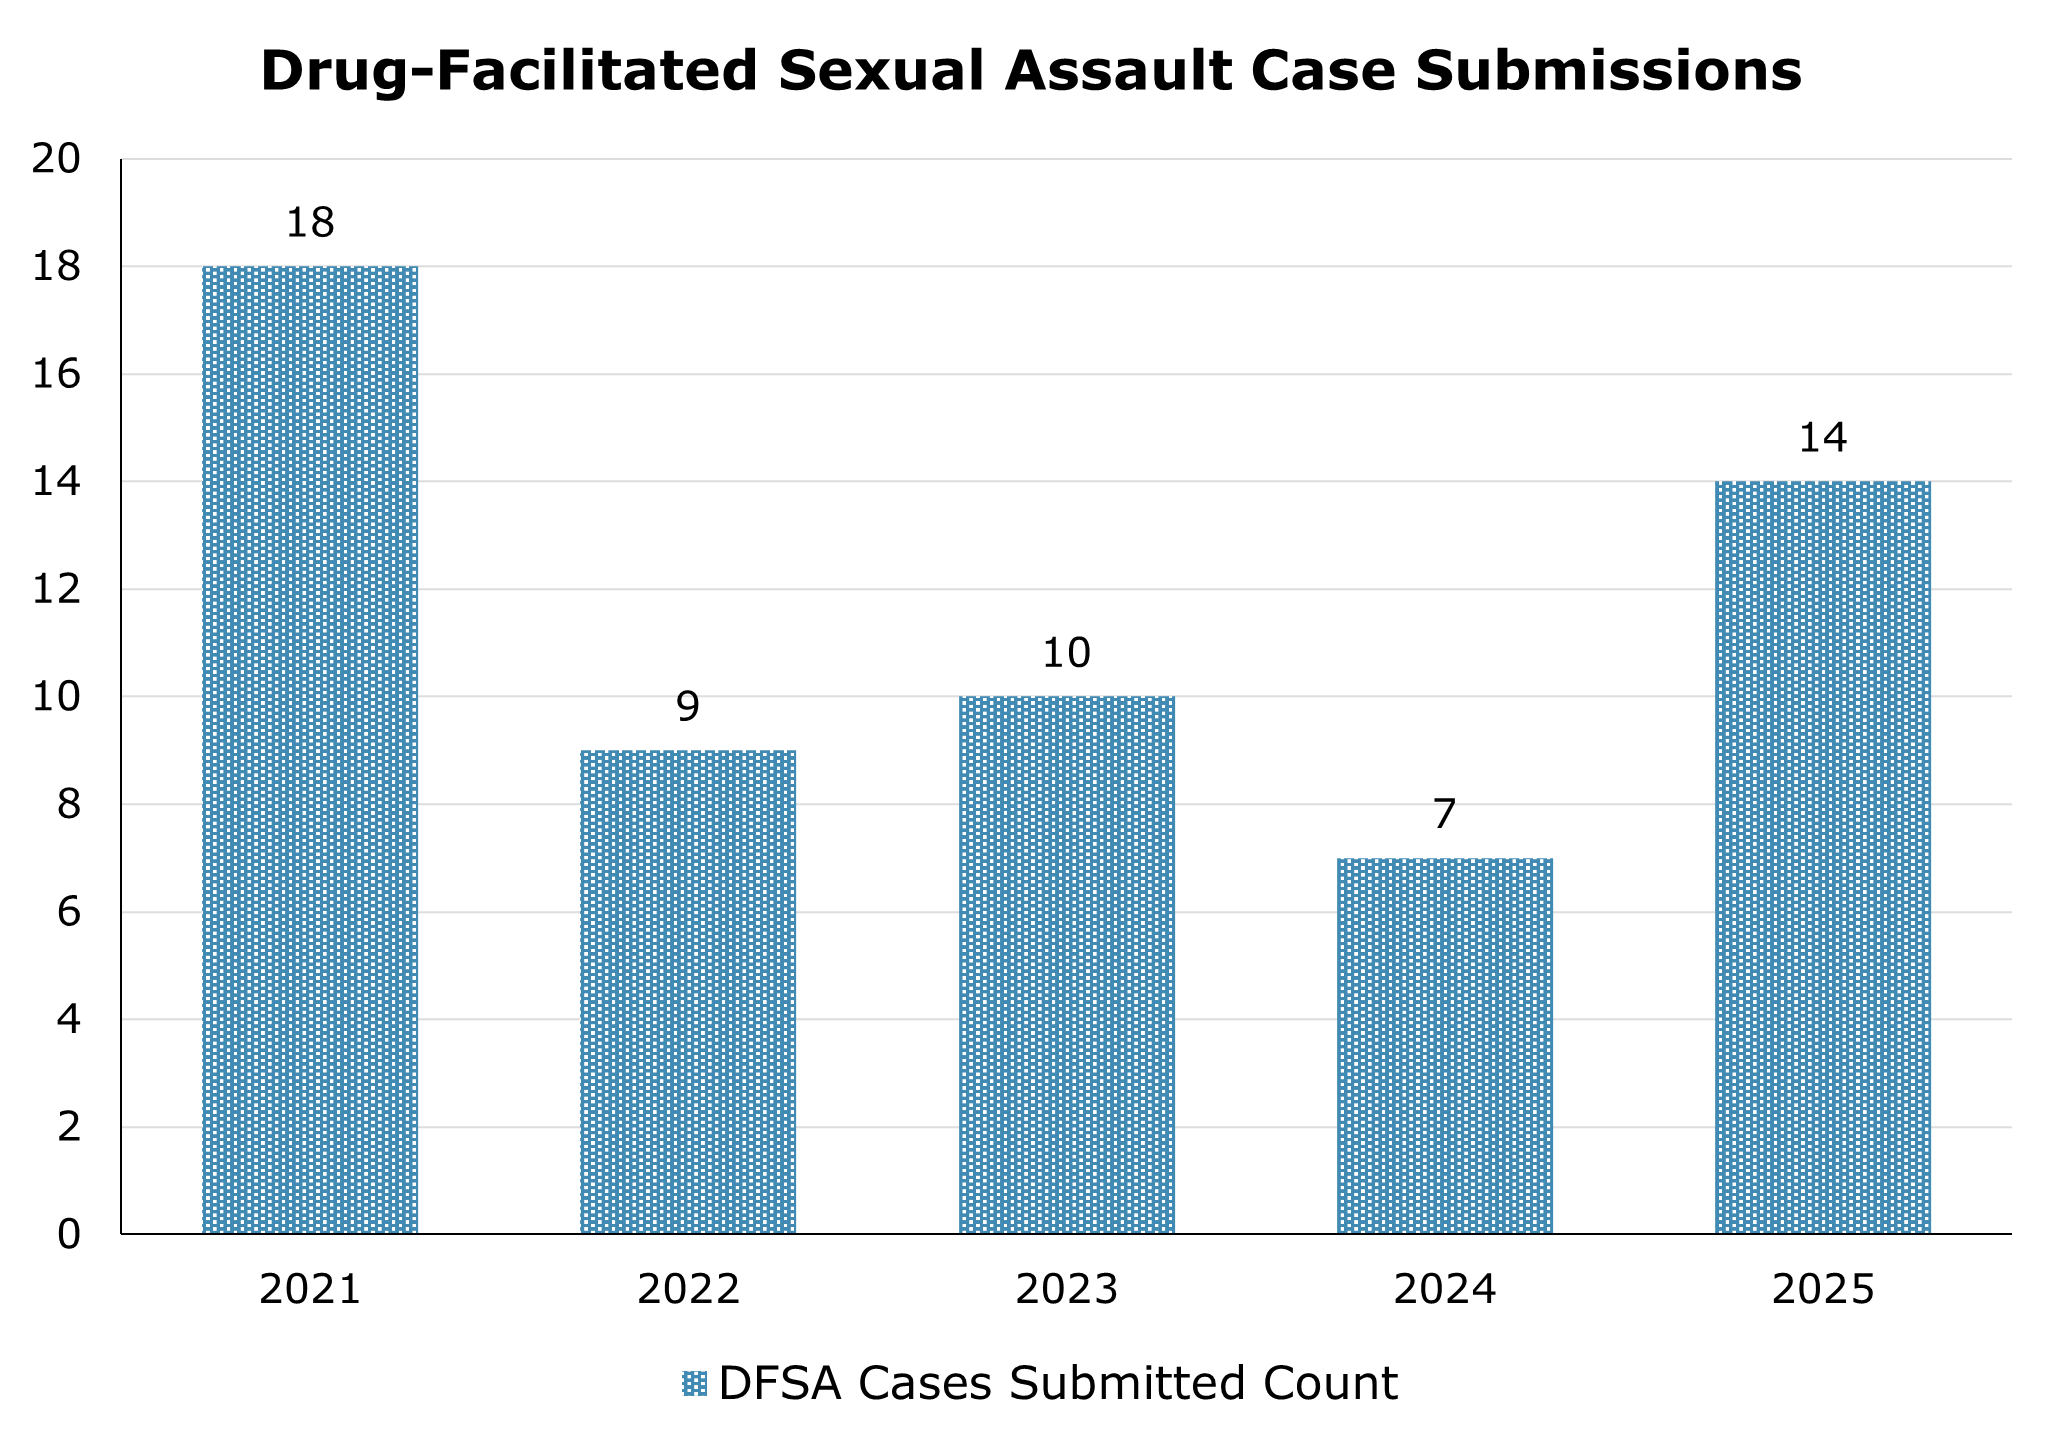
Figure 27 shows that DFSA cases submitted declined from 18 cases in 2021 to 9 in 2022, followed by 10 cases in 2023 and 7 in 2024. The number of submitted cases then increased to 14 in 2025.
| 2021 | 2022 | 2023 | 2024 | 2025 | |
|---|---|---|---|---|---|
| DFSA Cases Submitted Count | 18 | 9 | 10 | 7 | 14 |
Expert Testimony
Court testimony is the culmination of forensic science work and scientists are trained to convey complicated technical information and results to juries. The professional staff is frequently called upon to present expert testimony in court. The amount of time spent by staff preparing for testimony, waiting to testify at courthouses, and on the stand providing testimony is significant.
In 2025, the Forensic Science Laboratories received subpoenas for 112 criminal cases and provided expert testimony in 39.