2024 Pathology Division Annual Report
Table of Contents
- History and Overview
- Mission
- Pathology Leadership
- Pathology Organization
- Counties Served
- Distribution of Cases: In-County vs. Out-of-County
- Medical Investigations
- Case Examinations
- Autopsy Reports
- Cause and Manner of Death
- Toxicology
- Indigent Burials and Cremations
History and Overview
The Regional Forensic Science Center officially opened on December 21st, 1995. The Center houses the Pathology Division (including the District Coroner's Office) and the Forensic Science Laboratories. The Pathology Division is organized into two sections: Medical Investigations and Autopsy Services.
As mandated by law [KSA 22a-231], the District Coroner's Office has the responsibility for investigating deaths within Sedgwick County that occur as a result of violence, by unlawful means, suddenly when in apparent health, in a suspicious or unusual manner, or when in police custody. The District Coroner's Office's jurisdiction also applies to deaths of individuals not regularly attended by a physician and when the determination of the cause of death is held to be in the public interest. The primary goal of investigation and the postmortem examination is to determine cause and manner of death in order to generate a death certificate.
Cause of death is the injury or disease that results in death. Manner of death is determined by circumstances in which the death occurred and can be categorized as natural, accident, homicide, suicide, and undetermined. Undetermined manner of death is used when circumstances are unknown or are unclear.
The Pathology Division has been accredited by the National Association of Medical Examiners (NAME) since 2001.
Mission
The Forensic Science Center strives to provide the highest quality medicolegal and advanced forensic laboratory services to Sedgwick County. Death Investigation and Forensic Autopsy services are conducted in a compassionate and objective manner to achieve accurate certification of cause and manner of death. The Forensic Laboratory services provide unbiased and accurate analytical testing to support the resolution of criminal cases. As an independent agency operating under the Division of Public Safety, the Forensic Science Center collaborates with public health and criminal justice stakeholders to reduce crime and prevent deaths.
Pathology Leadership
Director
Shelly Steadman, PhD
District Coroner-Chief Medical Examiner
Timothy S. Gorrill, MD, PhD
Chief Medical Investigator
Shari L. Beck, F-ABMDI
Quality Assurance and Compliance Manager
Robert C. Hansen II, M.S.F.S.
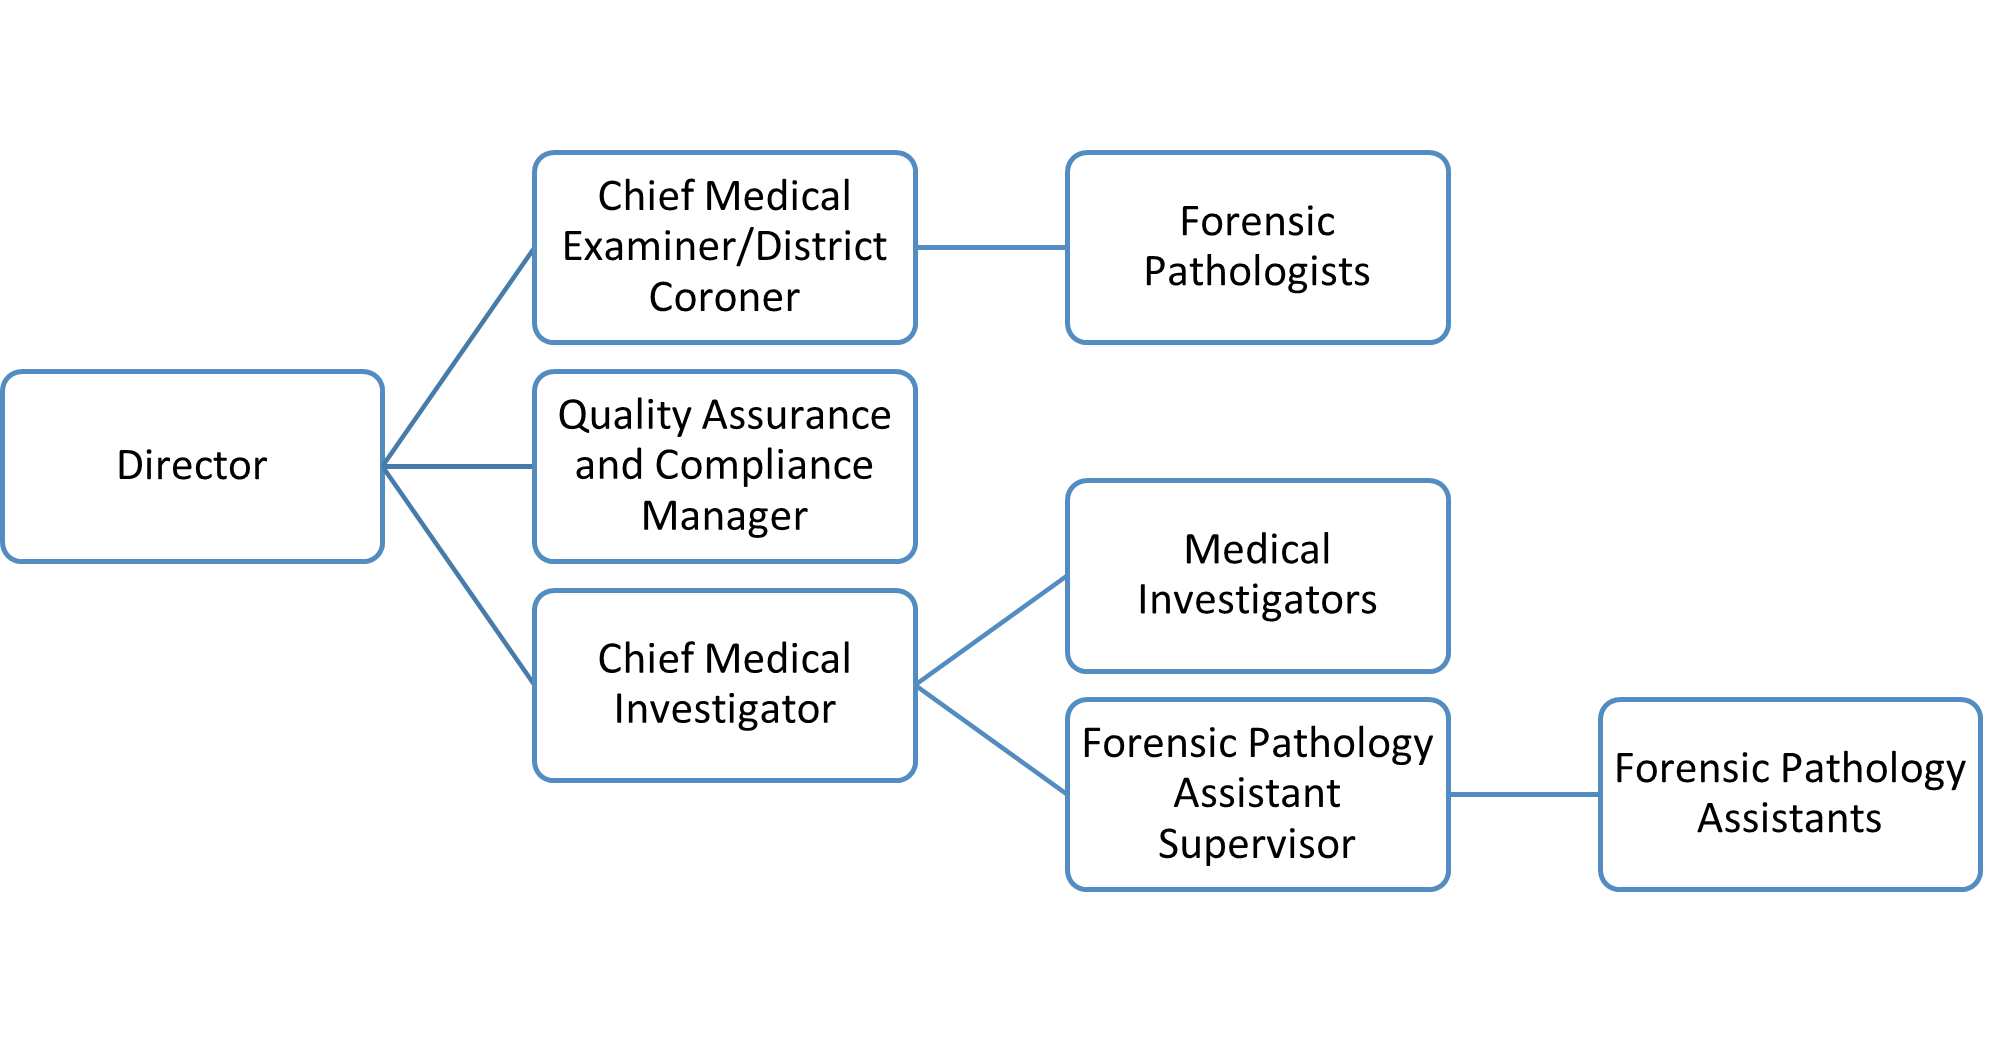
Pathology Organization
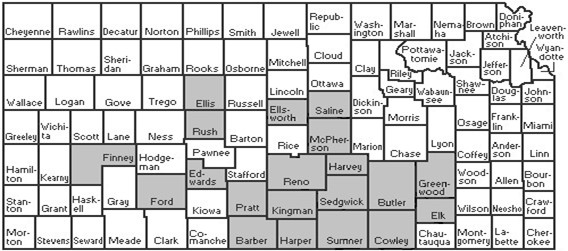
Counties Served
In 2024, the majority of services provided were for Sedgwick County; however, the Center does provide, on a fee-for-service basis, autopsy examinations for many of the counties in the southcentral region of the state. In total, pathology examinations were performed on cases from 20 counties in 2024 [Figure 1].
According to the latest census data, the approximate population living in Sedgwick County is 536,081 and the approximate metropolitan population including the contiguous counties is 763,766.
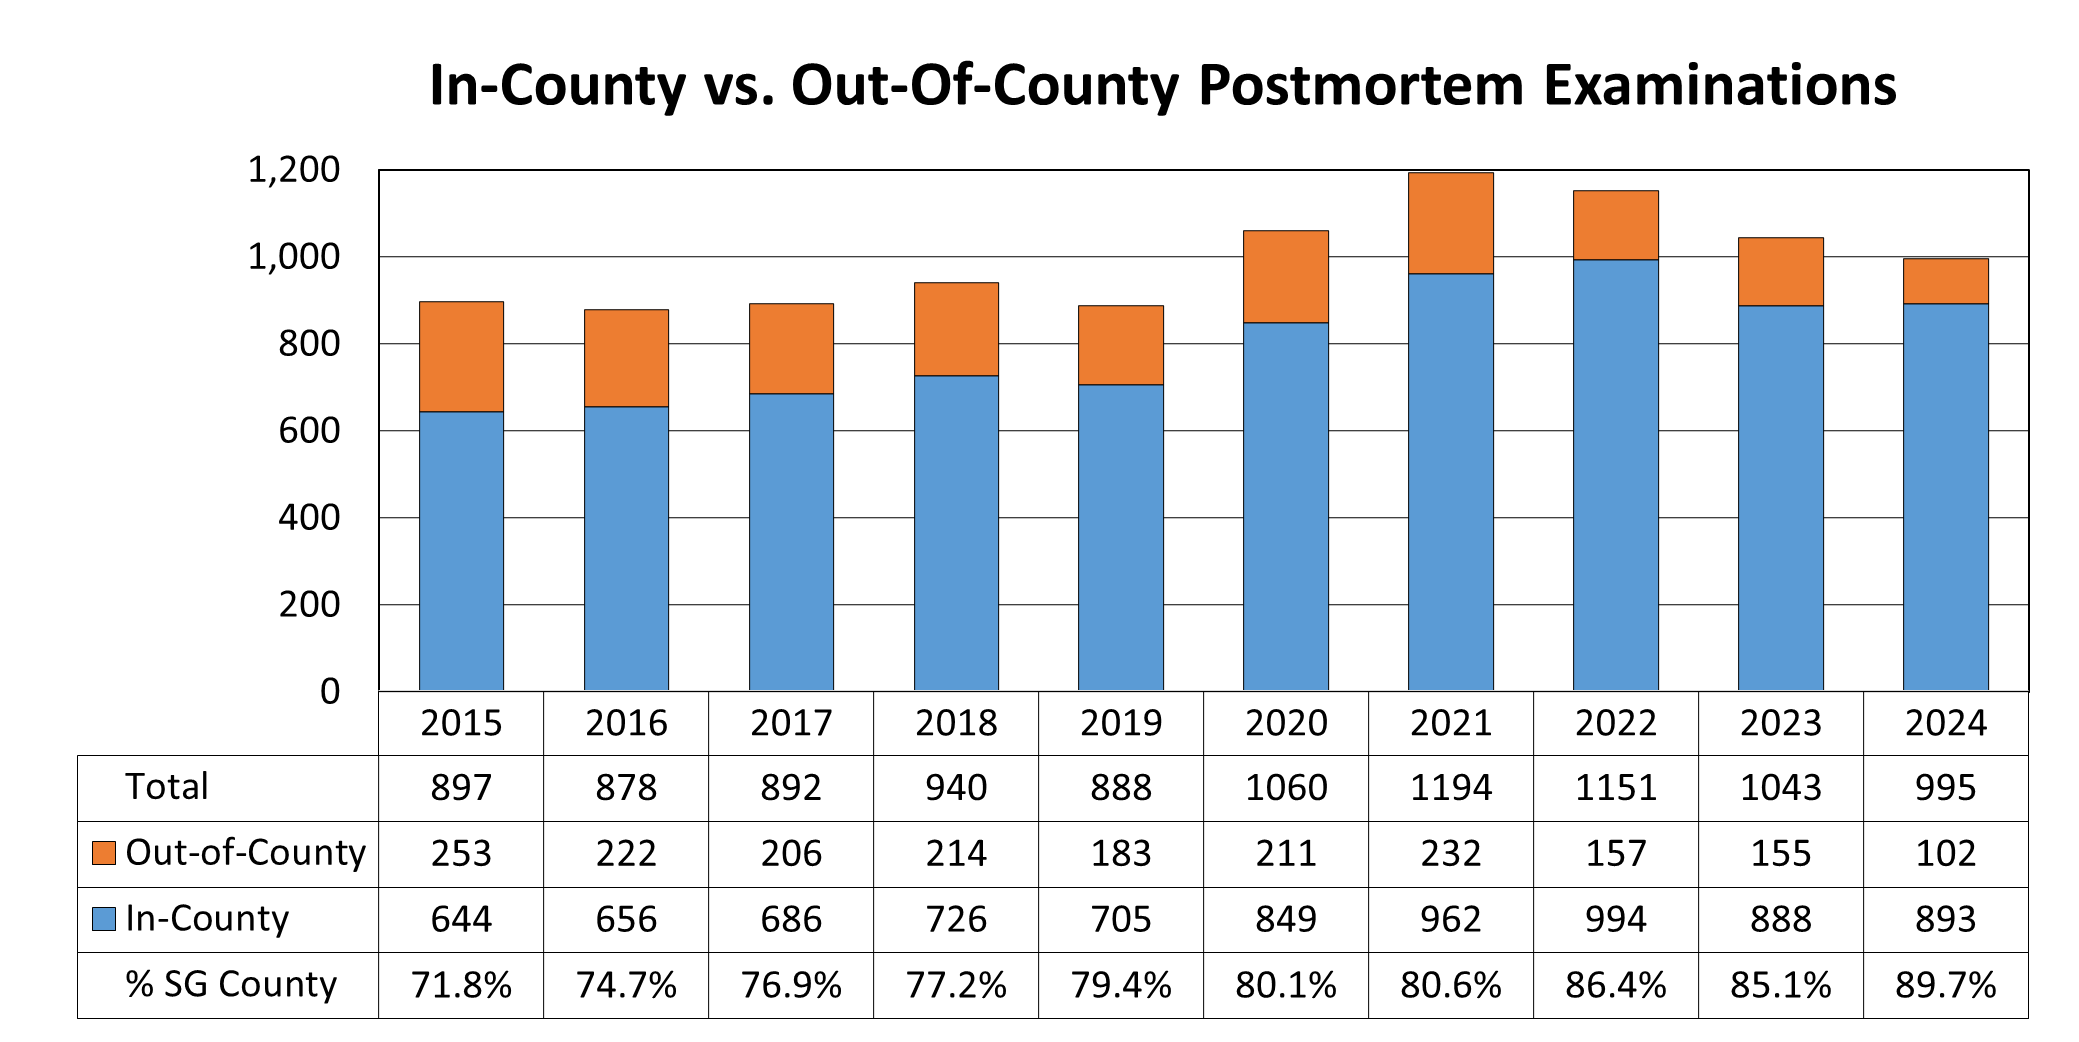
Distribution of Cases: In-County vs. Out-of-County
The Pathology Division serves as a resource to other counties in the state of Kansas. In 2024, approximately 10.3% of the examinations were performed for other counties [Figure 2]. Also, when compared to 2015 there has been an approximate 38.6% increase in the number of Sedgwick County examinations.
| 2015 | 2016 | 2017 | 2018 | 2019 | 2020 | 2021 | 2022 | 2023 | 2024 | |
|---|---|---|---|---|---|---|---|---|---|---|
| Total | 897 | 878 | 892 | 940 | 888 | 1060 | 1194 | 1151 | 1043 | 995 |
| Out-of-County | 253 | 222 | 206 | 214 | 183 | 211 | 232 | 157 | 155 | 102 |
| In-County | 644 | 656 | 686 | 726 | 705 | 849 | 962 | 994 | 888 | 893 |
| % SG County | 71.8 | 74.7 | 76.9 | 77.2 | 79.4 | 80.1 | 80.6 | 86.4 | 85.1 | 89.7 |
Medical Investigations
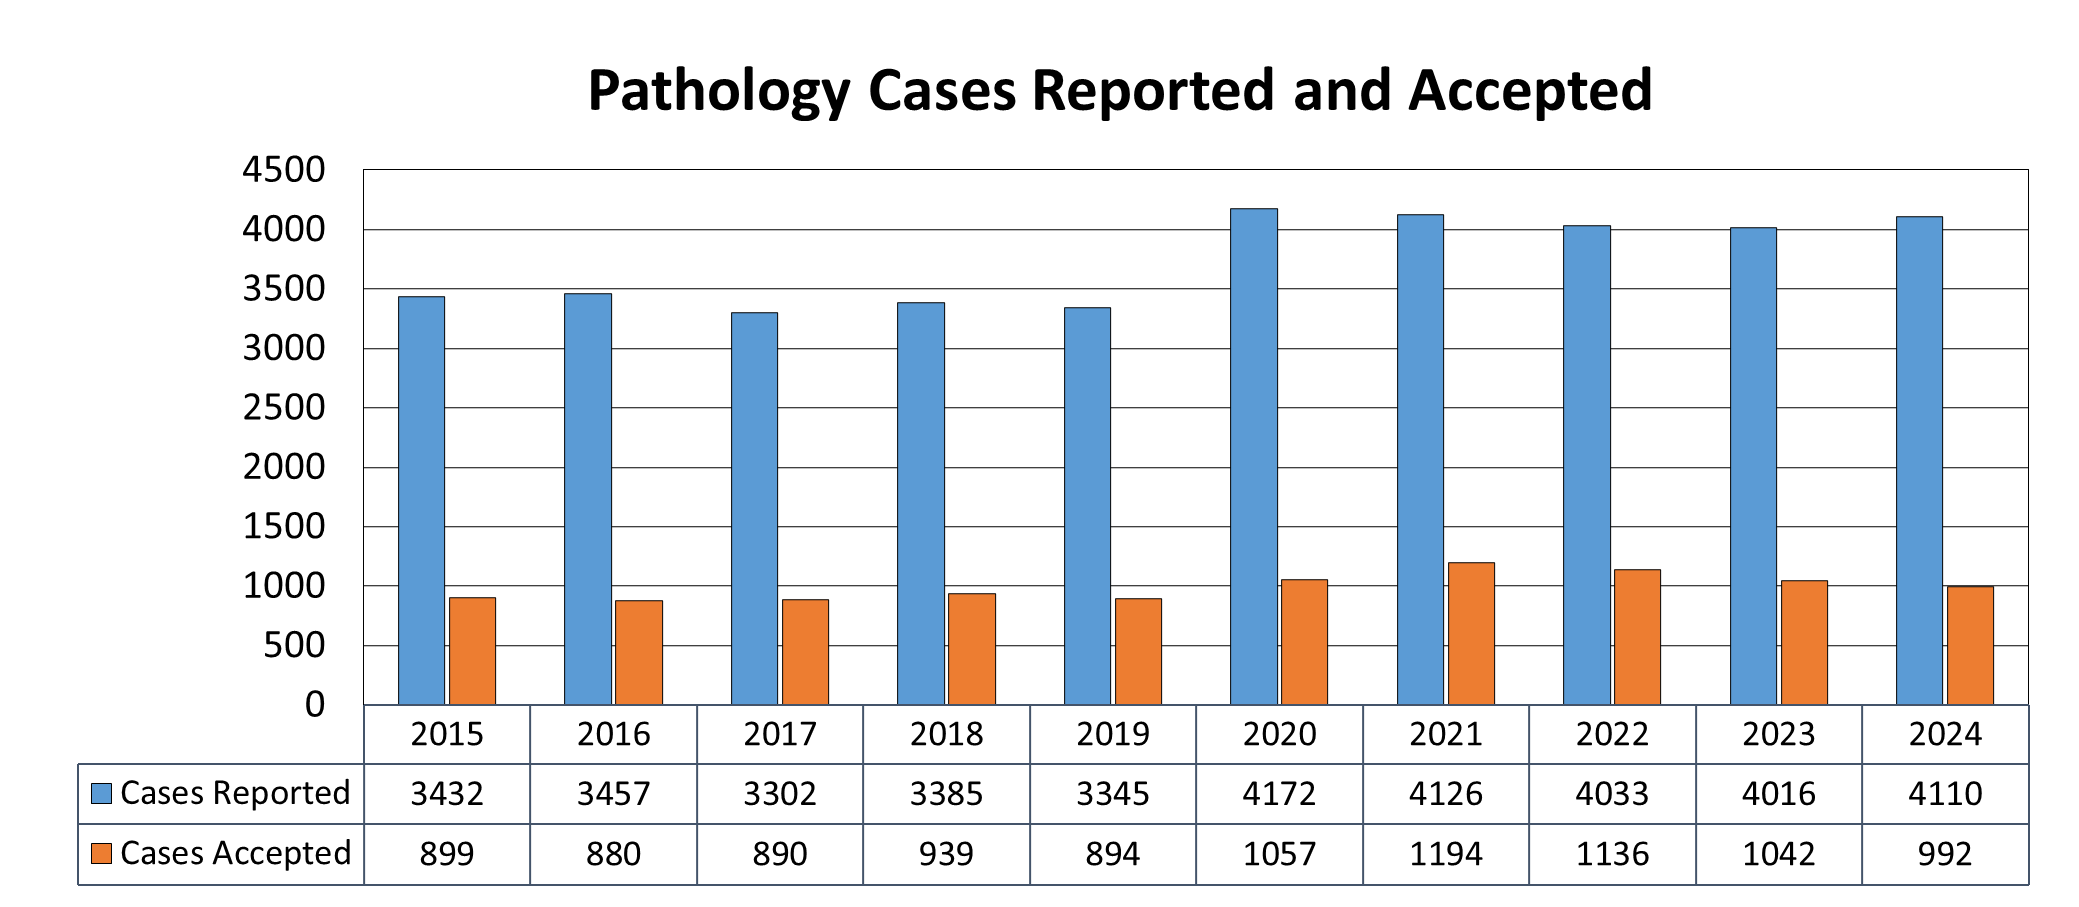
The Pathology division has a Chief Medical Investigator and six Medical Investigators. The Medical Investigators provide service every day, twenty-four hours a day, and seven days a week. On behalf of the District Coroner’s Office, the Medical Investigators triage all reported deaths, which totaled 4110 in 2024. When a death is determined to be under the jurisdiction of the District Coroner's Office, Medical Investigators respond to death scenes to document the scene and collect any evidence pertinent to the death investigation.
In 2024, the District Coroner's Office accepted 992 cases [Figure 3] from the deaths reported, including postmortem examinations and physician records and/or death certificate reviews. Cumulatively over the last 10 years, cases accepted by the District Coroner's Office constitute 26.5% of the total number of deaths reported to the office. Also, when compared to 2015, there has been approximately a 19.8% increase in the number of reported deaths and approximately a 10.3% increase in the number of District Coroner's Office cases accepted for examination in 2024.
| 2015 | 2016 | 2017 | 2018 | 2019 | 2020 | 2021 | 2022 | 2023 | 2024 | |
|---|---|---|---|---|---|---|---|---|---|---|
| Cases Reported | 3432 | 3457 | 3302 | 3385 | 3345 | 4172 | 4126 | 4033 | 4016 | 4110 |
| Cases Accepted | 899 | 880 | 890 | 939 | 894 | 1057 | 1194 | 1136 | 1042 | 992 |
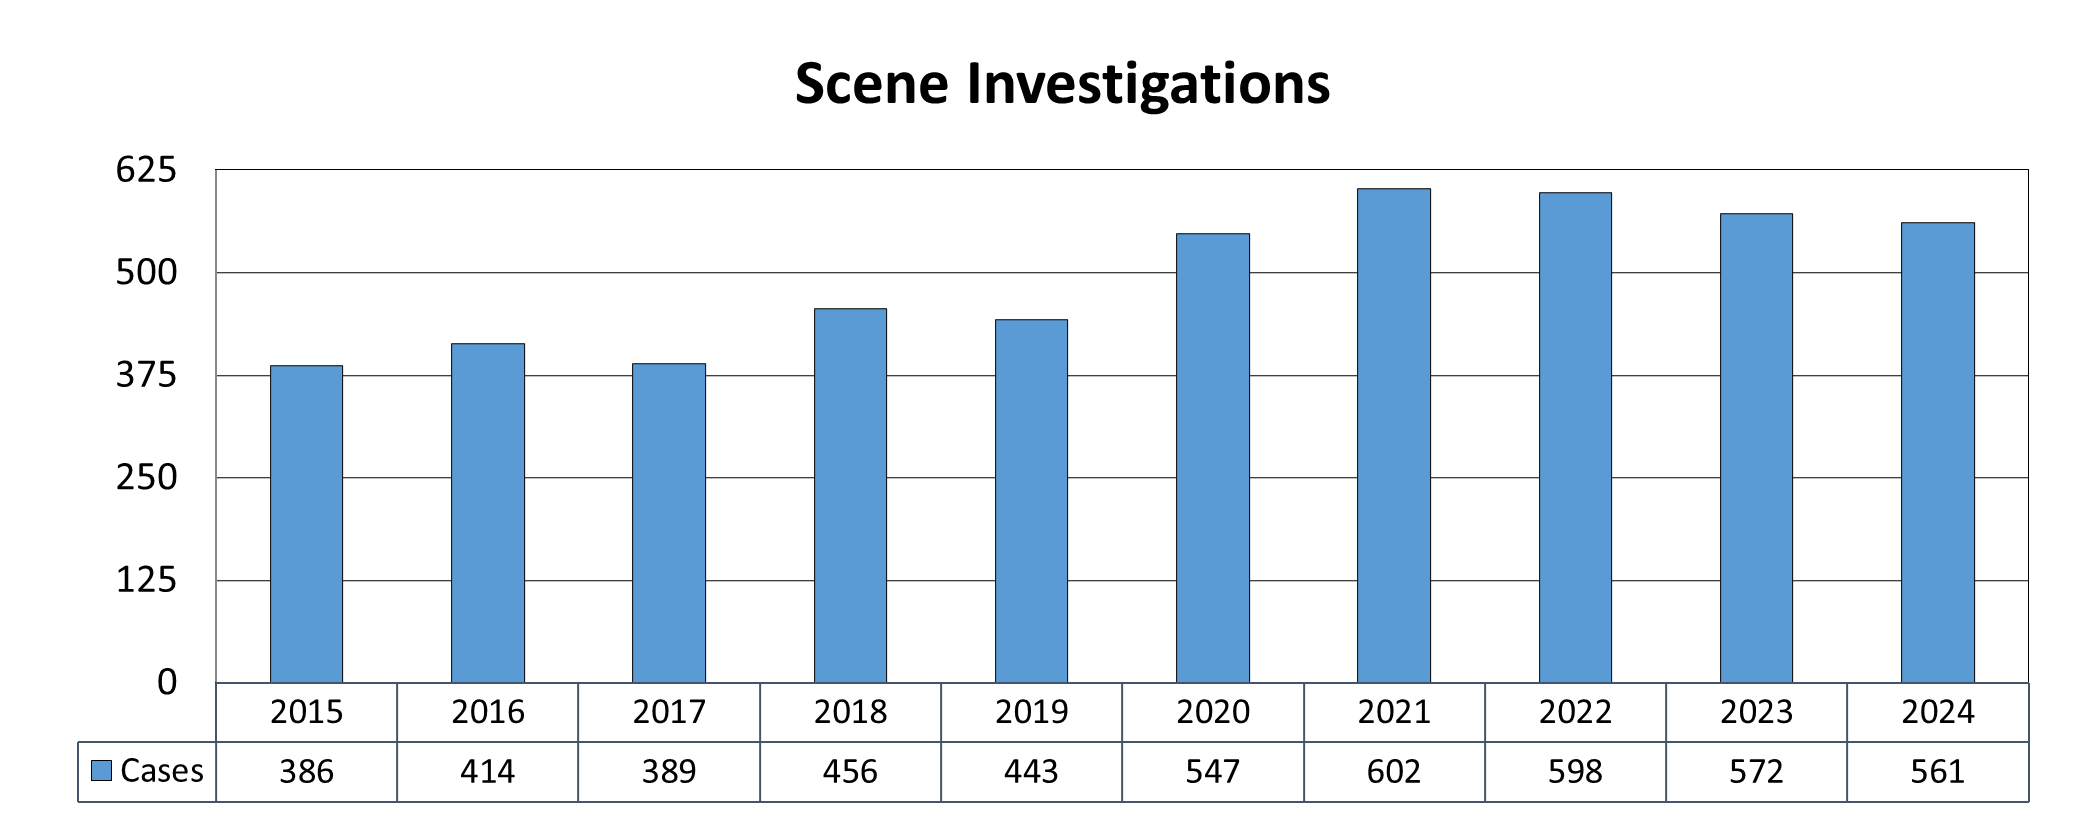
Medical Investigators may attend the scene of a death when it occurs outside of a hospital setting. Pertinent circumstantial and physical observations are documented and photographed, and items of evidence are collected in accordance with state law, good forensic principles and accreditation requirements established by the National Association of Medical Examiners [NAME]. The number of scene investigations by Medical Investigators per year [Figure 4] has shown a steady increase over the last 10 years, although the number has decreased since the peak of 2021. Between 2015 and 2024 there has been approximately a 45.3% increase in the number of death scenes attended by medical investigators.
| 2015 | 2016 | 2017 | 2018 | 2019 | 2020 | 2021 | 2022 | 2023 | 2024 | |
|---|---|---|---|---|---|---|---|---|---|---|
| Case | 386 | 414 | 389 | 456 | 443 | 547 | 602 | 598 | 572 | 561 |
Case Examinations
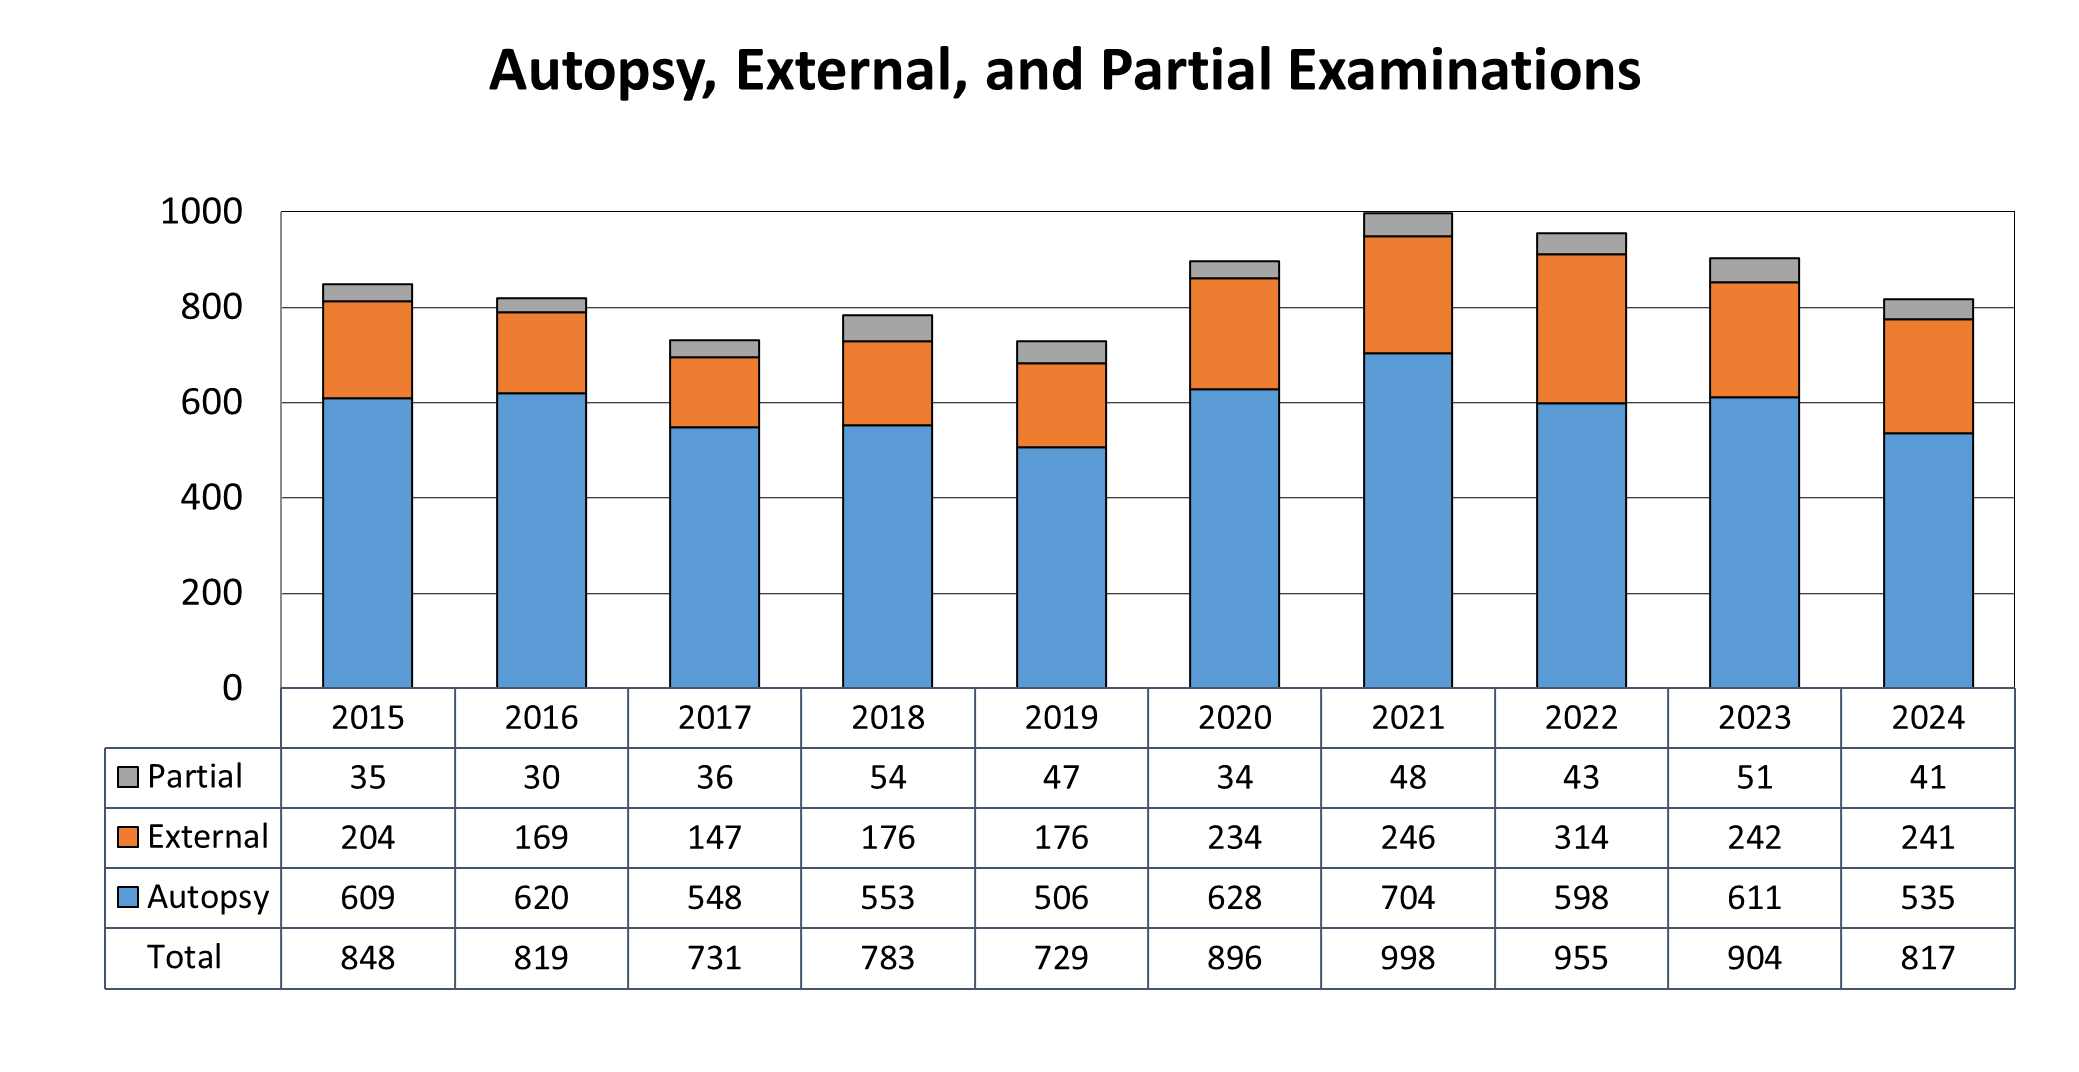
Figure 5 shows the number of postmortem examinations conducted on the body of decedents, which includes full autopsies, partial autopsies, and external examinations. The figure does not include administrative examination types, which include record reviews and death certificate reviews.
Full autopsies are comprehensive examinations of the entire body. Partial autopsies are postmortem examinations that focus on specific organs, areas, or systems of the body. External examinations are performed in cases where scene investigation, circumstances, medical history, and the exam are sufficient to certify the death. In 2024, approximately 65.4% of the examinations were full autopsies, 29.4% were external examinations, and 5.0% were partial examinations.
| 2015 | 2016 | 2017 | 2018 | 2019 | 2020 | 2021 | 2022 | 2023 | 20224 | |
|---|---|---|---|---|---|---|---|---|---|---|
| Partial | 35 | 30 | 36 | 54 | 47 | 34 | 48 | 43 | 51 | 41 |
| External | 204 | 169 | 147 | 176 | 176 | 234 | 246 | 314 | 242 | 241 |
| Autopsy | 609 | 620 | 548 | 553 | 506 | 628 | 704 | 598 | 611 | 535 |
| Total | 848 | 819 | 731 | 783 | 729 | 896 | 998 | 955 | 904 | 817 |
Autopsy Reports
One important metric to monitor the work efficiency of the Pathology Division is the percentage of autopsy reports completed within 90 days of the examination. Usually, the percentage of cases that meet this mark is dependent upon how quickly the Toxicology Laboratory can complete testing and how quickly the case pathologist can complete his/her autopsy reports following the issuance of the toxicology report. In 2024, the pathology division saw an increase in the percentage of cases that meet the goal of 90% cases completed within 90 days from examination [Figure 6].
| 2019 | 2020 | 2021 | 2022 | 2023 | 2024 | |
| Autopsy Reports <90 Days | 66% | 45% | 37% | 25% | 35% | 72% |
| Toxicology Reports <60 Days | 41% | 20% | 14% | 16% | 18% | 66% |
| Toxicology Reports <90 Days | 68% | 48% | 33% | 31% | 48% | 82% |

Cause and Manner of Death
Cause of Death
The cause of death is a term used to indicate the medical cause of death. It lists the disease(s) or injuries that caused death. Specific cause of death information is recorded on the death certificate and is entered into the Vital Statistics System of the State of Kansas.
The reason(s) why an accident occurred, a person took their own life, or why one person killed another person are not investigated by the District Coroner's Office for the purpose of death certification.
Manner of Death
The District Coroner’s Office is responsible for determining the manner of death, which is a way to categorize death as required by the Kansas Department of Health and Environment. The classifications of manner of death are natural, accidental, suicide, homicide, and undetermined.
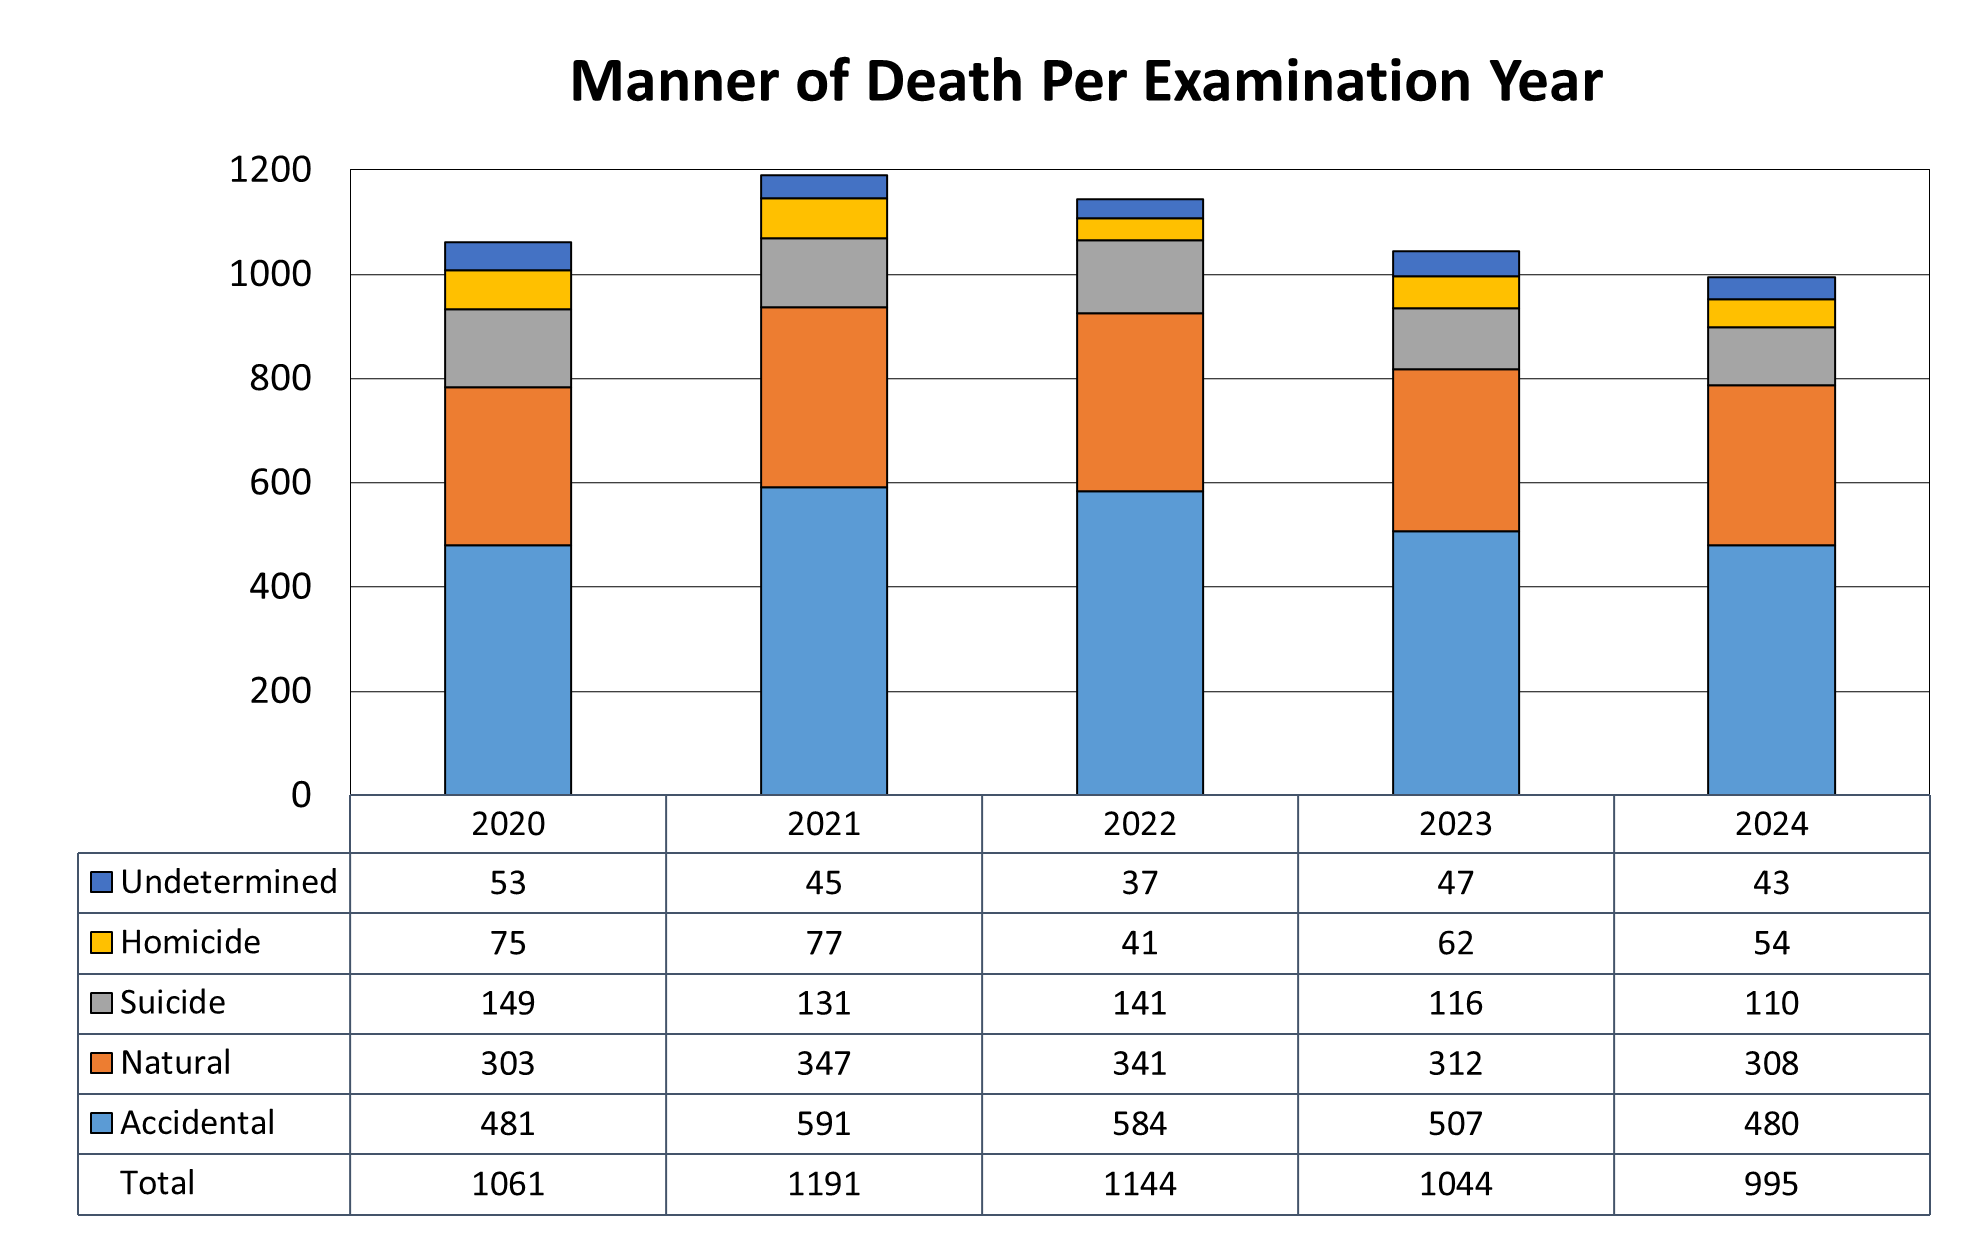
Figure 7 shows the breakdown of the deaths by manner from all case types, including full autopsies, partial autopsies, external examinations, and records reviews. Human and non-human skeletal remains are not included.
Homicides are deaths that result from injuries caused by the actions by another person. Homicides constituted 5.4% of the cases for 2024. The majority (90.7%) of these deaths resulted from gunshot wounds.
Suicides are defined as deaths that result from a purposeful action to end one’s own life. In 2024, approximately 11.0% of the cases were certified as suicides.
Approximately, 48.2% of deaths were certified as accidents, which are those that resulted from an unintentional event or chain of events. This category includes most motor vehicle accidents, falls, and accidental drug overdoses.
Natural deaths are those that are solely caused by natural disease and constituted approximately 30.9% of the cases. The most common cause of death in cases of sudden, unexpected natural death is coronary artery disease.
Cases that were classified as an undetermined manner of death constituted approximately 4.3% of the total caseload.
| 2020 | 2021 | 2022 | 2023 | 2024 | |
| Undetermined | 53 | 45 | 37 | 47 | 43 |
| Homicide | 75 | 77 | 41 | 62 | 54 |
| Suicide | 149 | 131 | 141 | 116 | 110 |
| Natural | 303 | 347 | 341 | 312 | 308 |
| Accidental | 481 | 591 | 584 | 507 | 480 |
| Total | 1061 | 1191 | 1144 | 1044 | 995 |
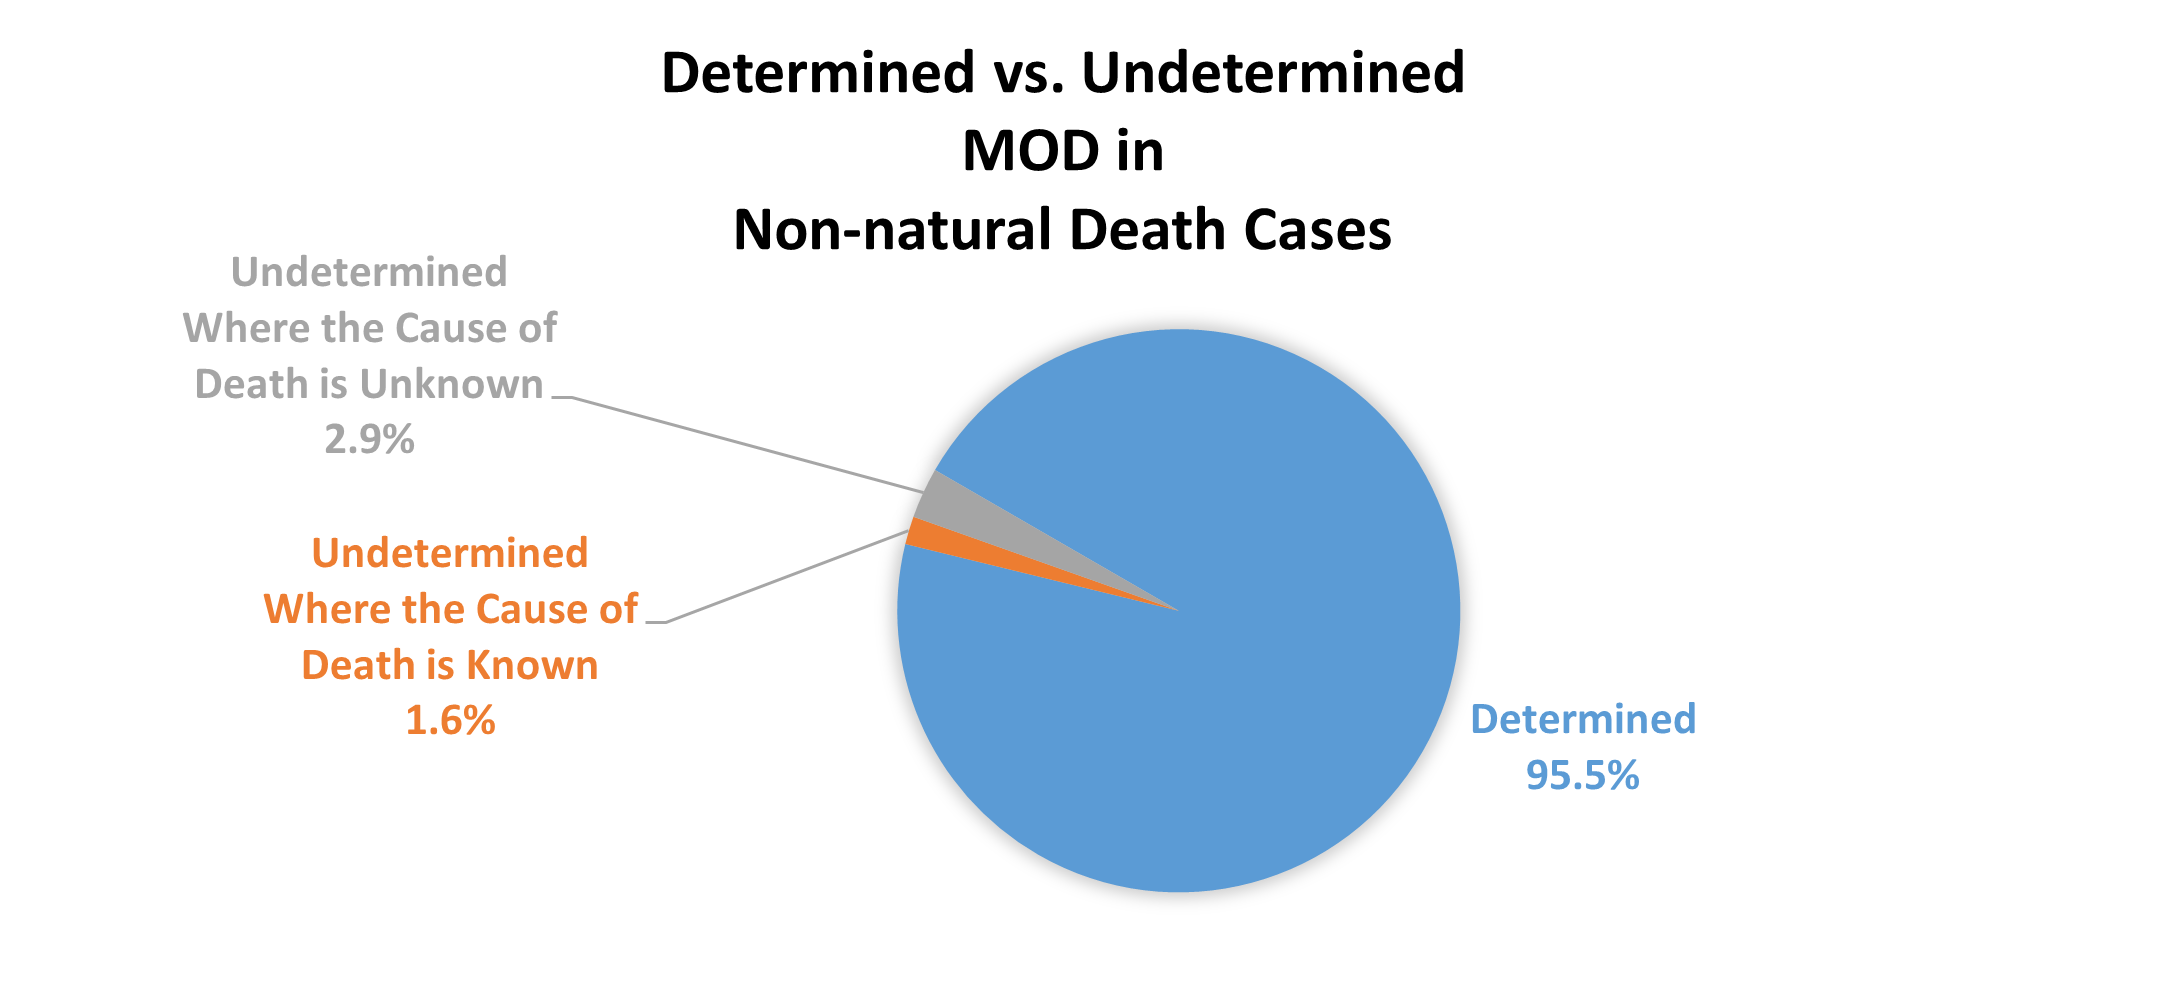
The manner of death (MOD) can be placed into two general categories, determined or undetermined. Figure 8 illustrates the percentages of these two categories for cases with a cause of death that is non-natural. Undetermined deaths are further broken down into those where the cause of death is known or cause of death is unknown.
| Determined | Undetermined Where the Cause of Death is Knonwn | Undetermined Where the Cause of Death in Unknown |
|---|---|---|
| 95.5% | 1.6% | 2.9% |
Accidents
In 2024, there were 480 autopsied cases that were determined to have an accidental manner of death. Table 1 illustrates that approximately 17.7% of all accidental deaths were related to motor vehicle accidents (MVA) and approximately 39.5% were overdoses/drug related. With manner of death determined for 995 cases in 2024, this means 19.1% of all cases were overdose/drug related.
| Method of Death | Number of Deaths | Percentage of Total |
|---|---|---|
|
Overdose/Drug Related |
190 |
39.5 |
|
Fall |
98 |
20.4 |
|
Motor Vehicle (MVA) |
85 |
17.7 |
|
Medical Miscellaneous |
19 |
3.9 |
|
Cardiovascular Disease |
14 |
2.9 |
|
Drowning |
12 |
2.5 |
|
Blunt Force Related |
8 |
1.6 |
|
Thermal Injuries |
8 |
1.6 |
|
Ethanol Toxicity |
6 |
1.2 |
|
Fire Exposure |
6 |
1.2 |
|
Mechanical Restraint |
5 |
1.0 |
|
Other |
5 |
1.0 |
|
Hypothermia |
4 |
0.8 |
|
Cancer |
3 |
0.6 |
|
CO Poisoning |
3 |
0.6 |
|
Sepsis |
3 |
0.6 |
|
Suffocation Asphyxia |
3 |
0.6 |
|
Diabetes |
2 |
0.4 |
|
Firearm Related |
2 |
0.4 |
|
Childhood SIDS/Co-Sleeping |
1 |
0.2 |
|
Electrocution |
1 |
0.2 |
|
Environmental Exposure |
1 |
0.2 |
|
Hyperthermia |
1 |
0.2 |
Homicides
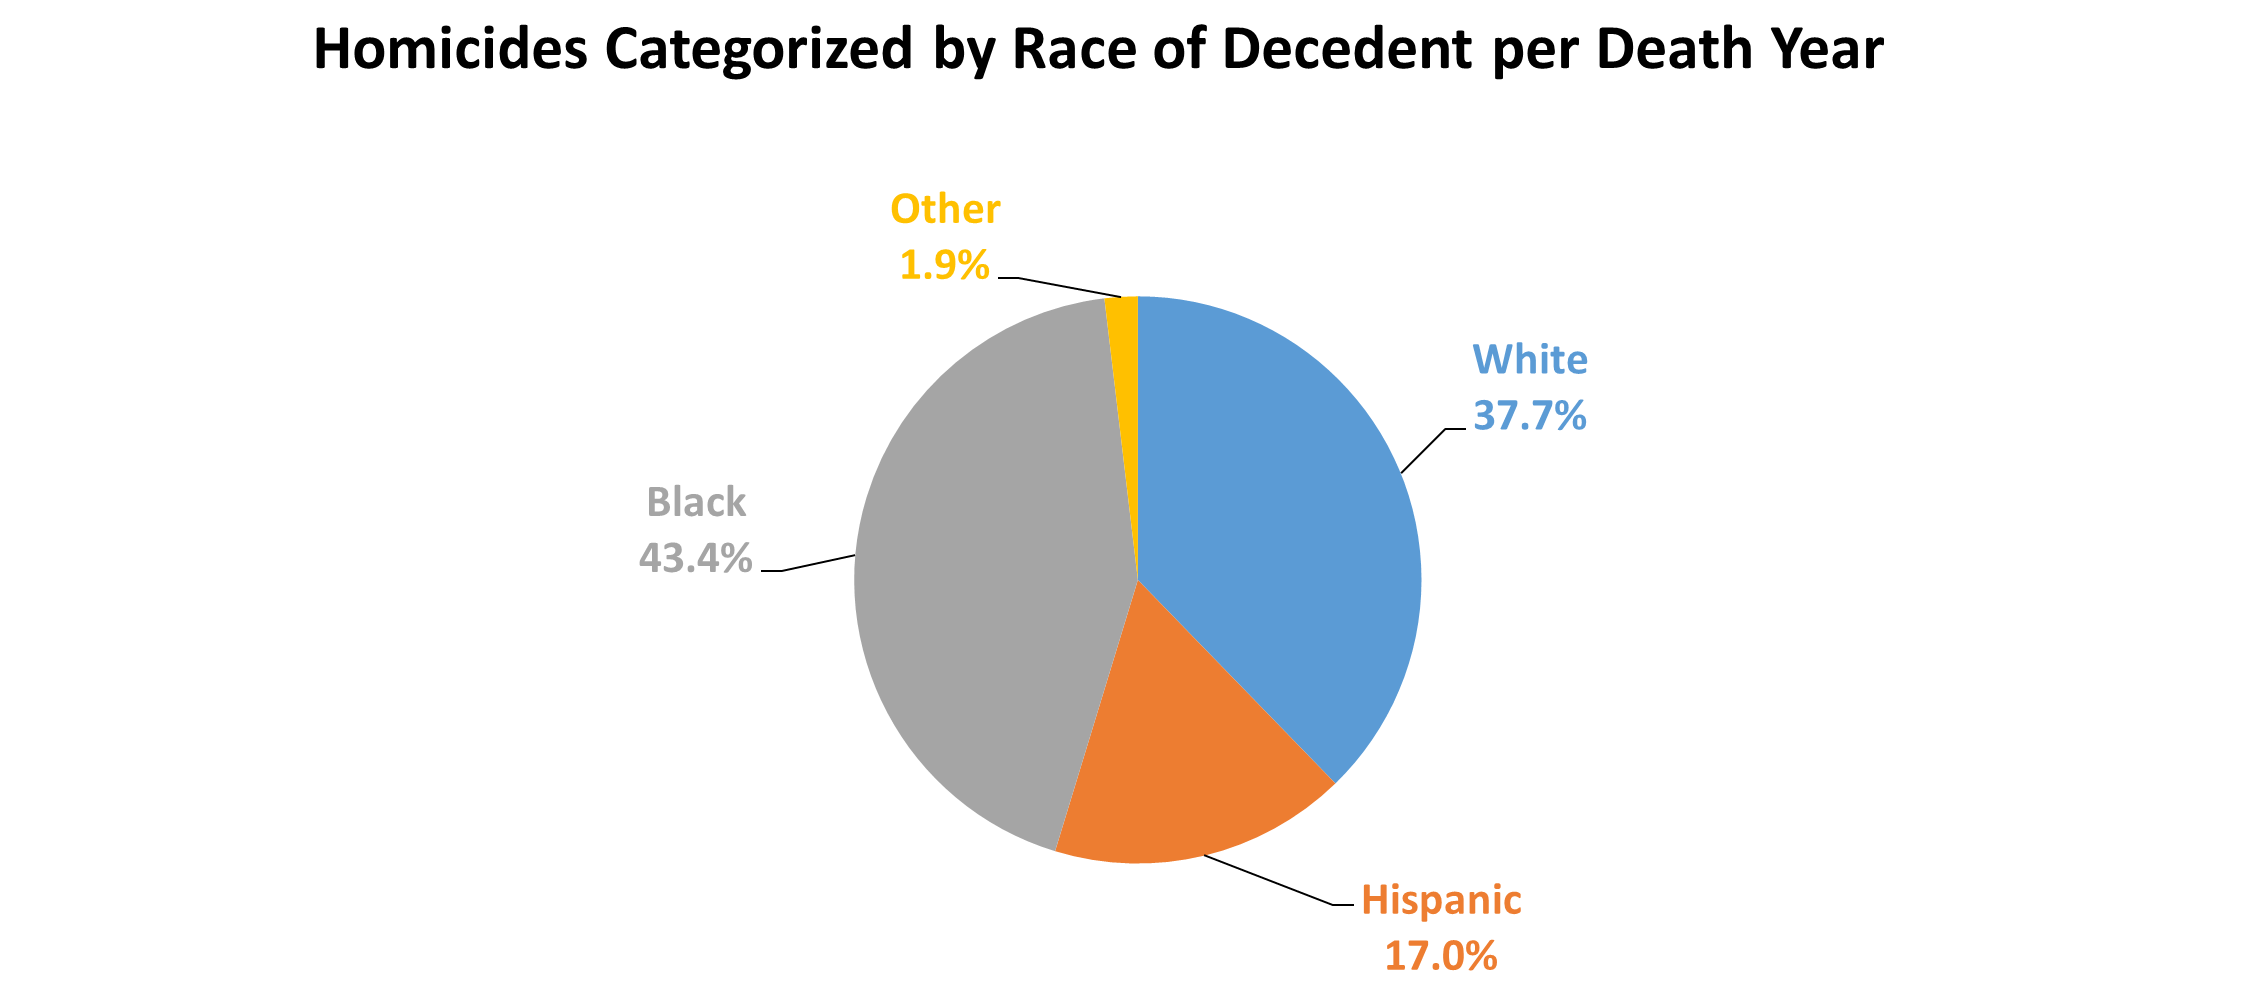
There were 53 homicides reported in 2024 that were examined by the District Coroner’s Office, a decrease of approximately 12.9% from the prior year. As illustrated in Figure 9, most homicides originated within Sedgwick County. Figure 10 and Figure 11 classify 2024 homicide victims by sex and race.
| 2015 | 2016 | 2017 | 2018 | 2019 | 2020 | 2021 | 2022 | 2023 | 2024 | |
| Out of County | 12 | 14 | 13 | 8 | 7 | 11 | 17 | 5 | 10 | 5 |
| Sedgwick County | 36 | 34 | 42 | 51 | 45 | 64 | 60 | 36 | 52 | 48 |
| Total | 48 | 48 | 55 | 59 | 52 | 75 | 77 | 41 | 62 | 53 |
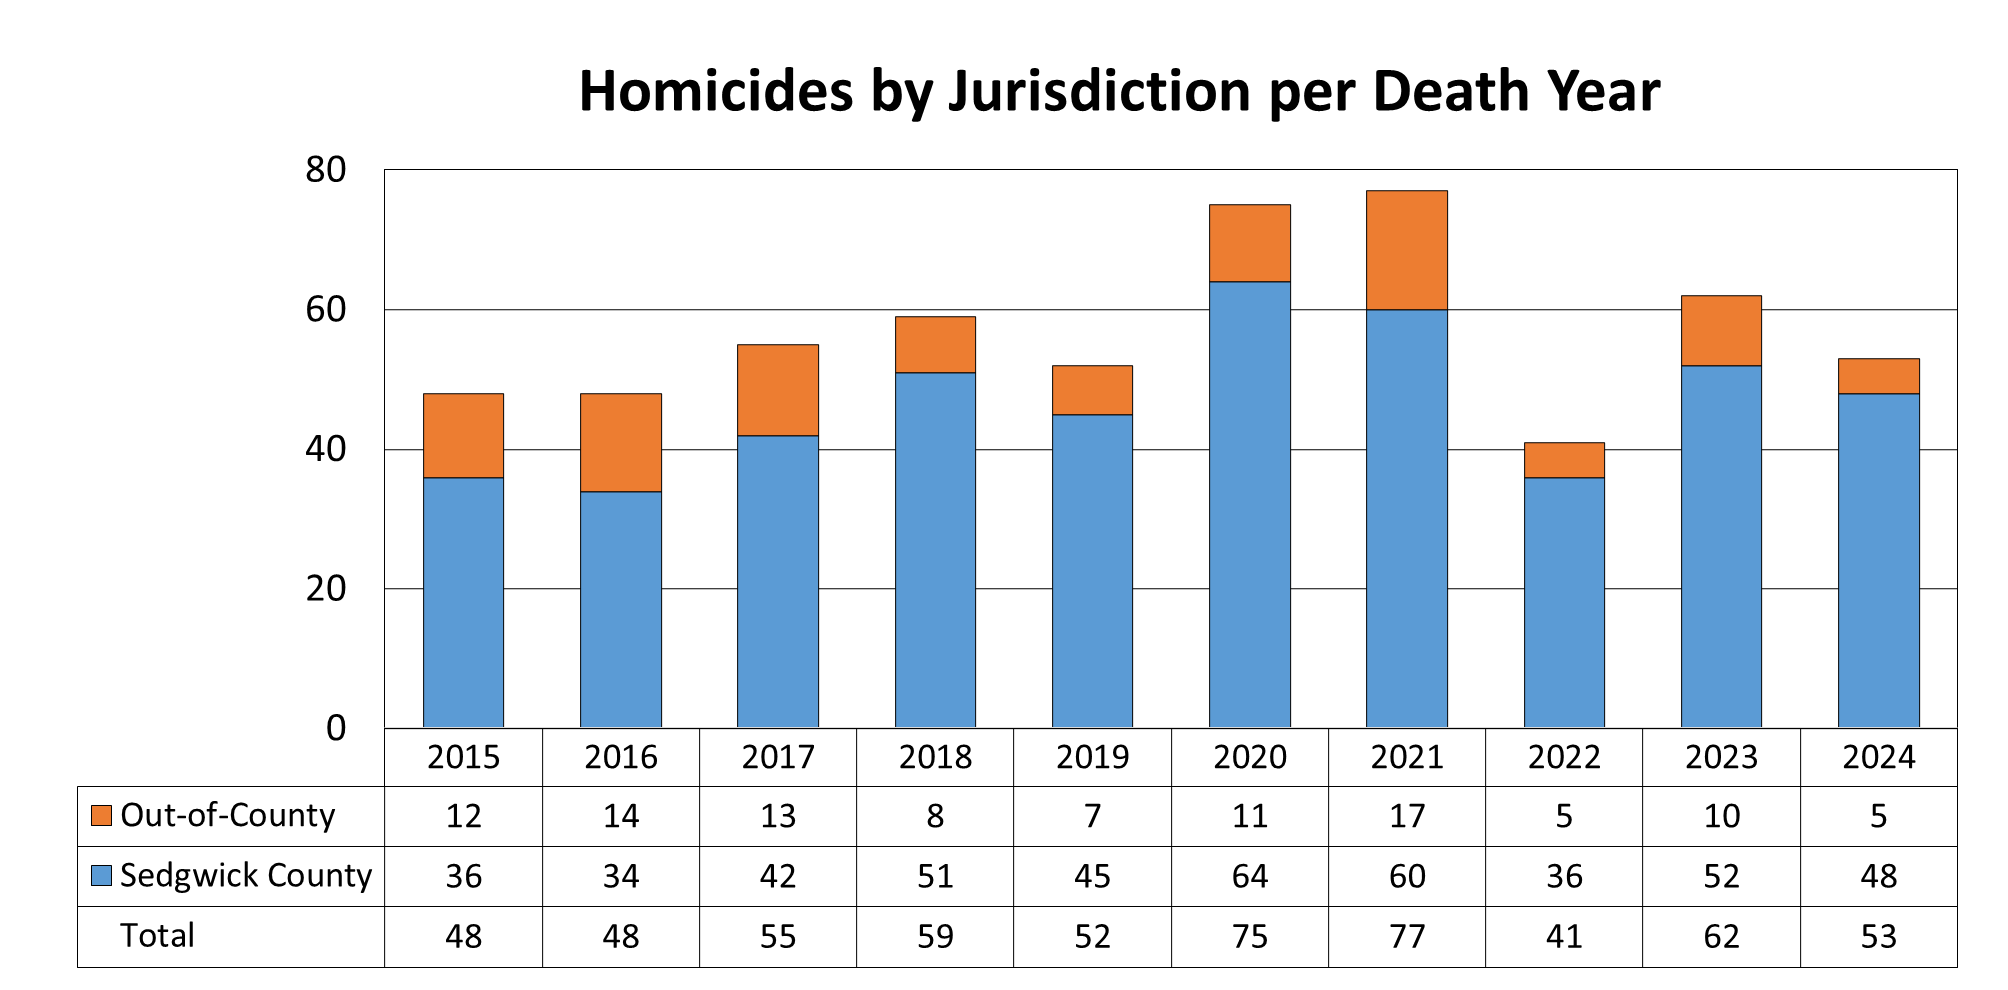
Figure 10 illustrates the percentage of homicides by decedent sex per death year.
| Male | Female |
|---|---|
| 83.0% | 17.0% |
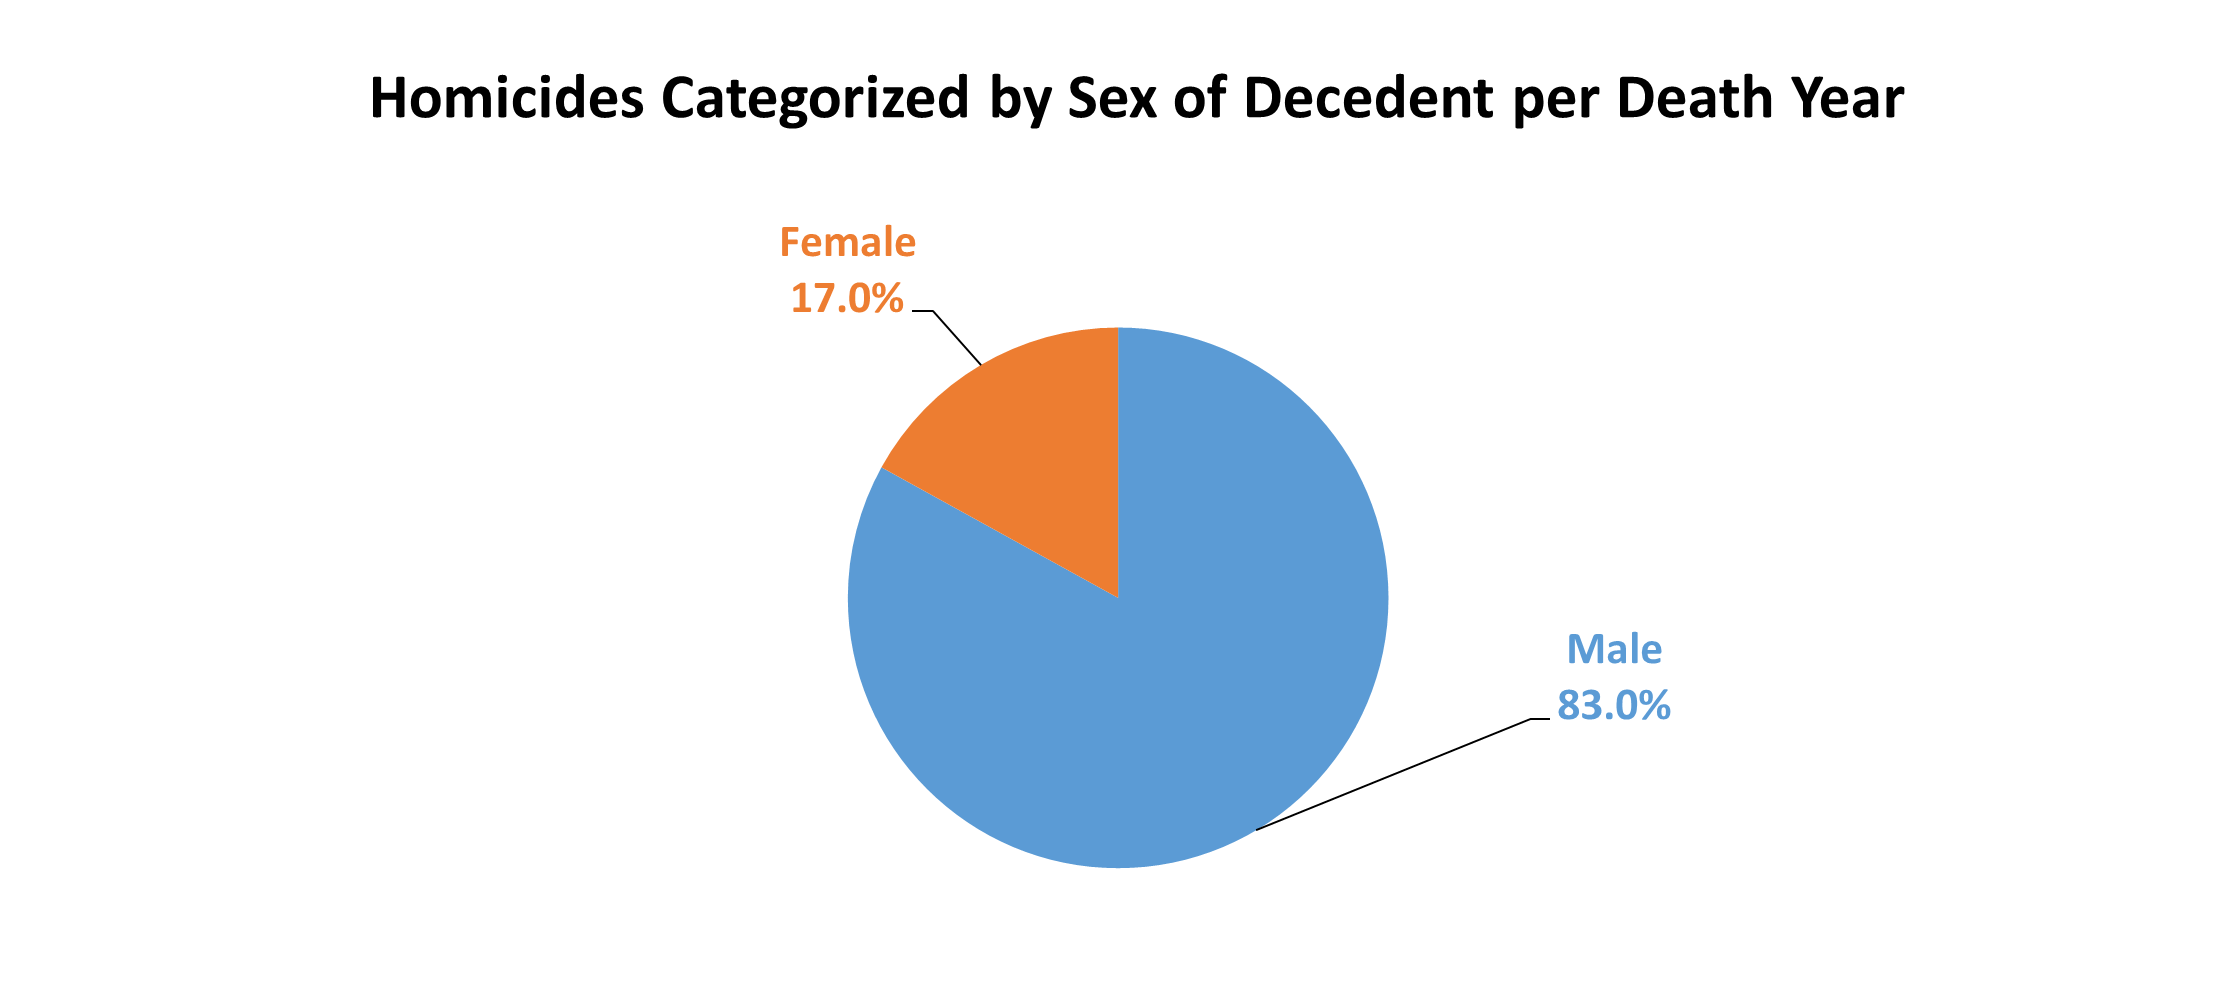
Figure 11 illustrates the percentage of homicides by race per death year.
| Black | Hispanic | White | Other |
|---|---|---|---|
| 43.4% | 17.0% | 37.7% | 1.9% |
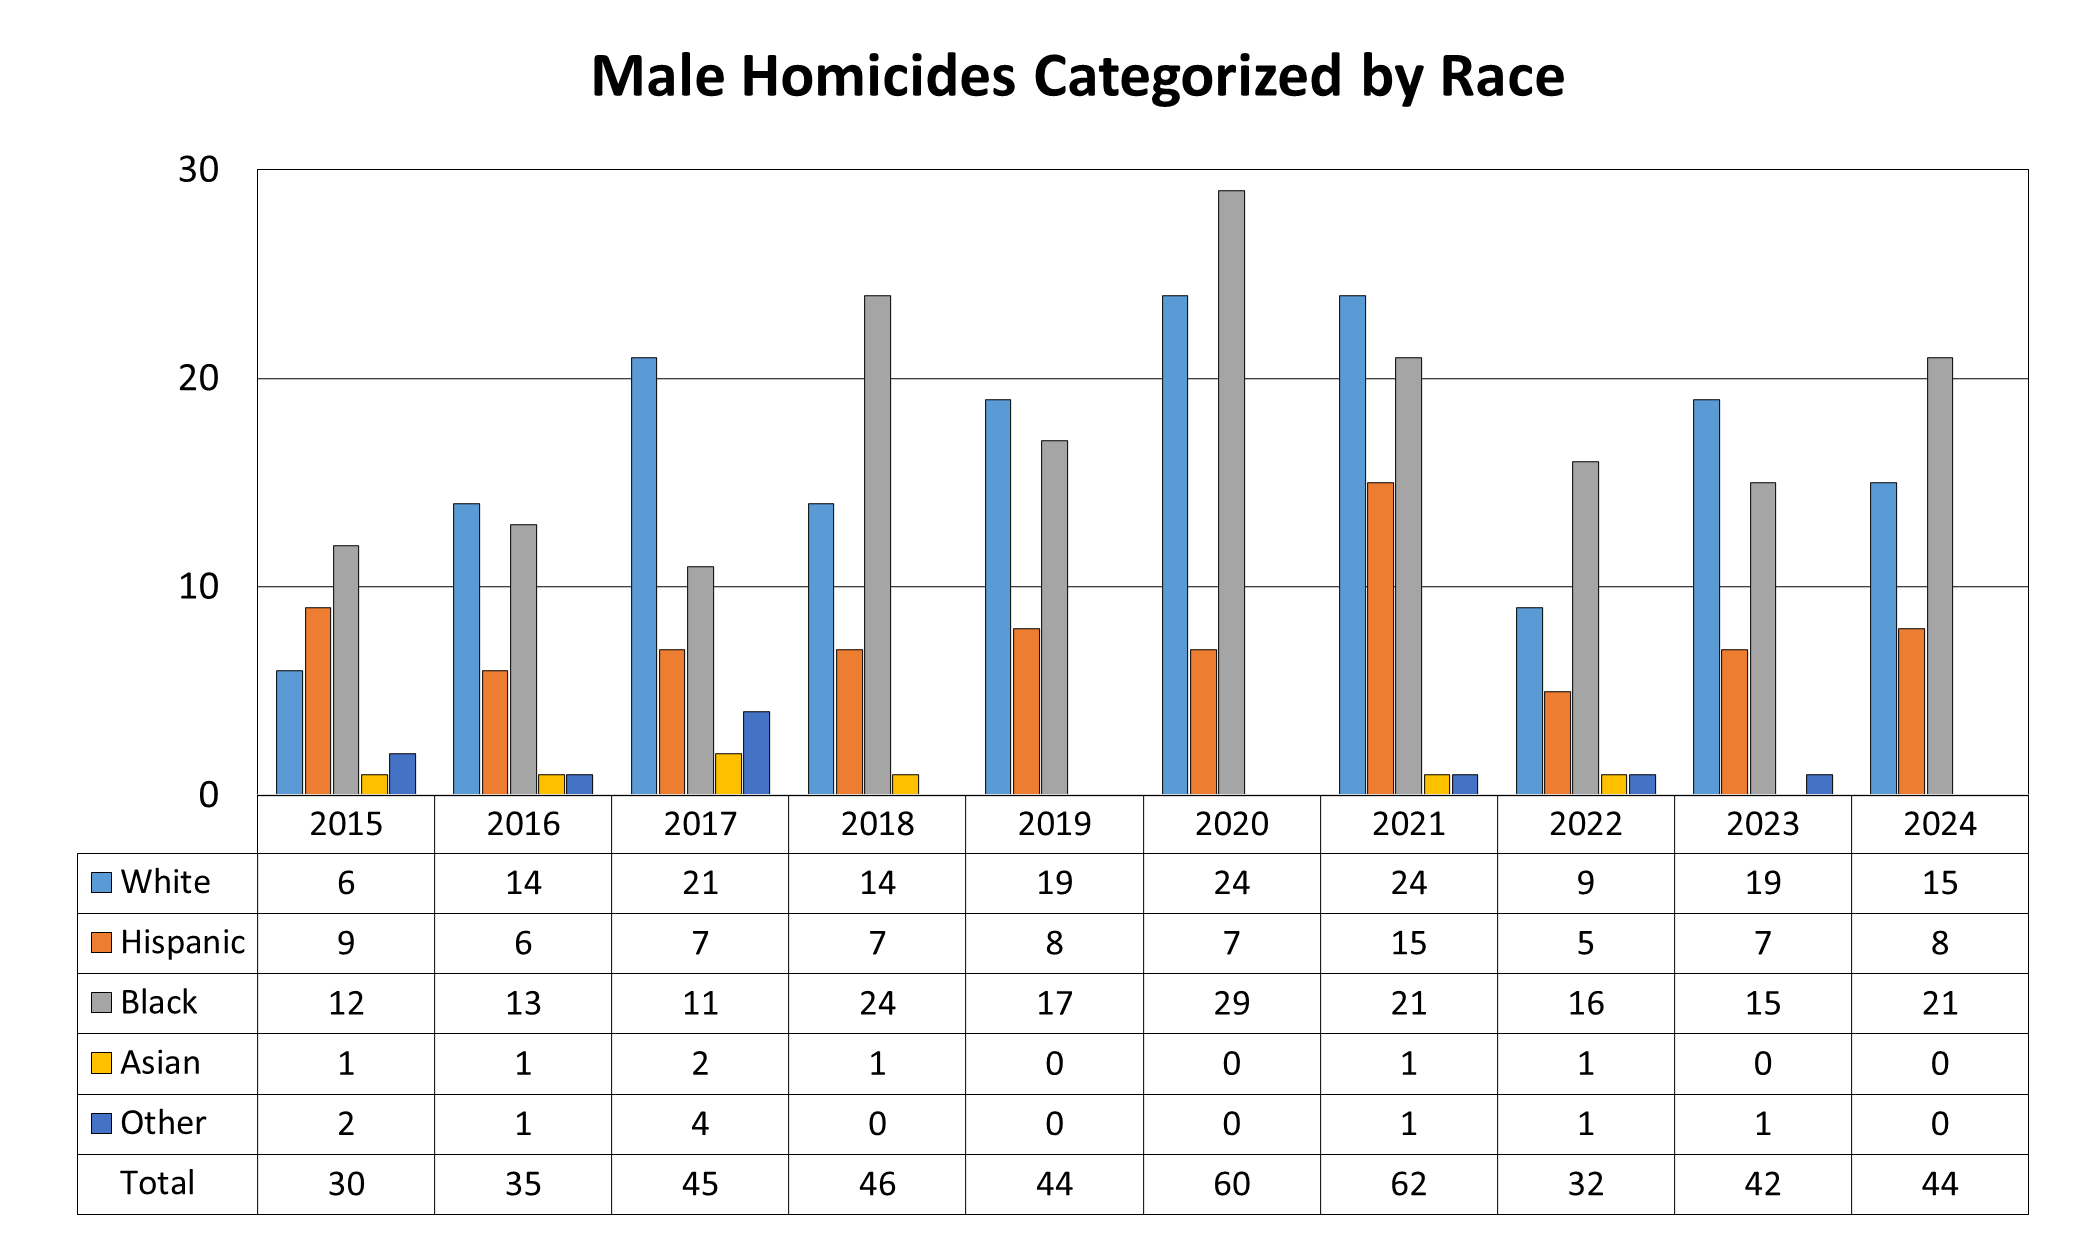
Figures 12 and 13 illustrate the number of homicides categorized by decedent sex and race over the past 10 years.
| 2015 | 2016 | 2017 | 2018 | 2019 | 2020 | 2021 | 2022 | 2023 | 2024 | |
| White | 6 | 14 | 21 | 14 | 19 | 24 | 24 | 9 | 19 | 15 |
| Hispanic | 9 | 6 | 7 | 7 | 8 | 7 | 15 | 5 | 7 | 8 |
| Black | 12 | 13 | 11 | 24 | 17 | 29 | 21 | 16 | 15 | 21 |
| Asian | 1 | 1 | 2 | 1 | 0 | 0 | 1 | 1 | 0 | 0 |
| Other | 2 | 1 | 4 | 0 | 0 | 0 | 1 | 1 | 1 | 0 |
| Total | 30 | 35 | 45 | 46 | 44 | 60 | 62 | 32 | 42 | 44 |
| 2015 | 2016 | 2017 | 2018 | 2019 | 2020 | 2021 | 2022 | 2023 | 2024 | |
|---|---|---|---|---|---|---|---|---|---|---|
| White | 8 | 6 | 5 | 11 | 6 | 9 | 8 | 7 | 11 | 5 |
| Hispanic | 2 | 3 | 3 | 2 | 0 | 3 | 2 | 2 | 1 | 1 |
| Black | 5 | 3 | 2 | 0 | 2 | 2 | 3 | 0 | 7 | 2 |
| Asian | 0 | 0 | 0 | 0 | 0 | 0 | 0 | 0 | 1 | 0 |
| Other | 3 | 1 | 0 | 0 | 0 | 1 | 2 | 0 | 0 | 1 |
| Total | 18 | 13 | 10 | 13 | 8 | 15 | 15 | 9 | 20 | 9 |
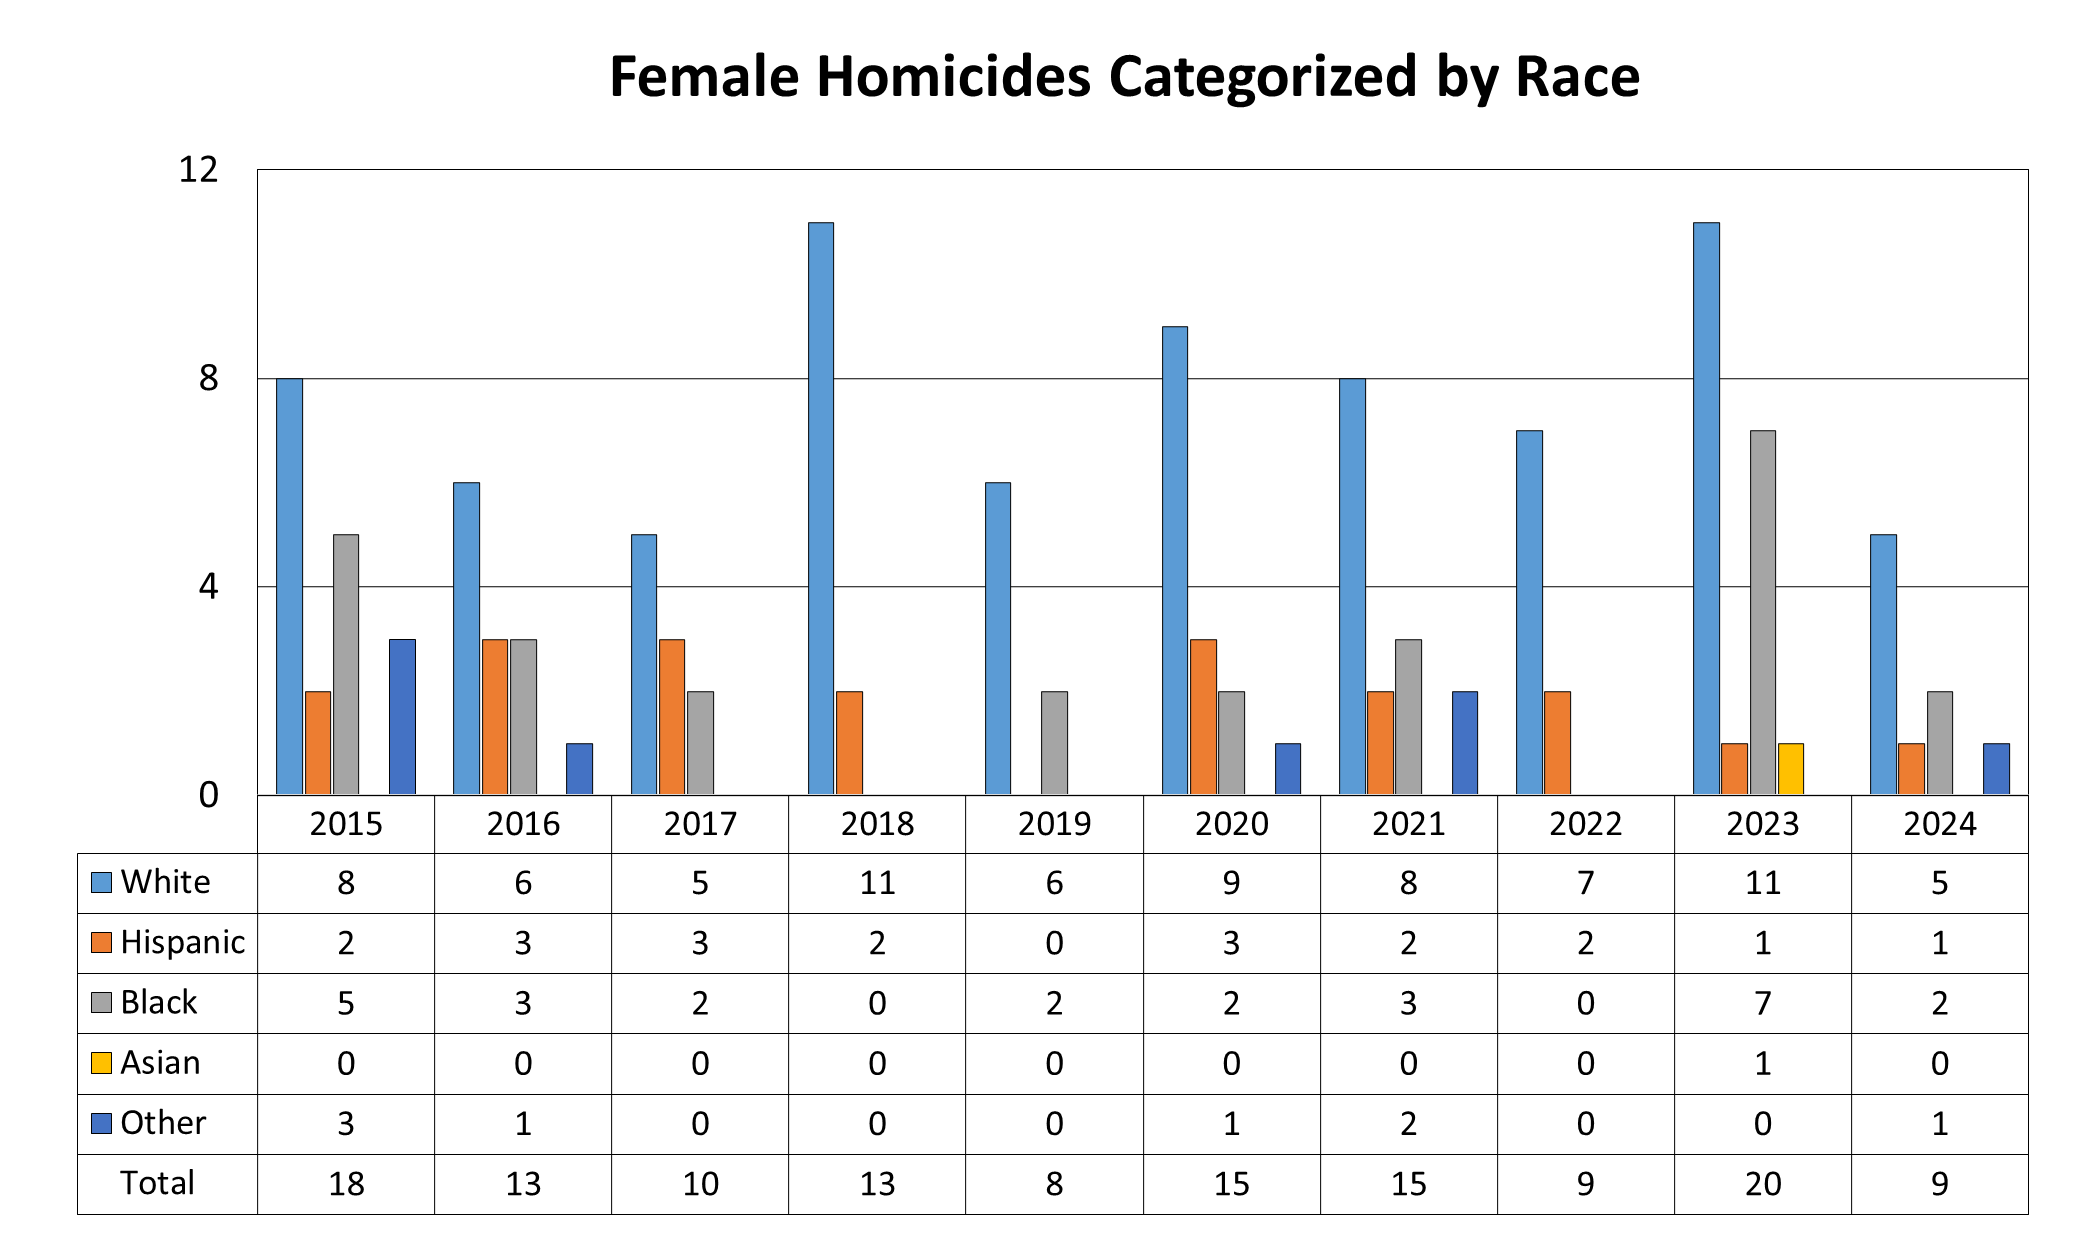
Figure 14 illustrates the number of homicide cases reported that are categorized by age group and death year. As depicted, most homicides involved decedents within the age group of 19-29 years old in 2024.
| 1 to18 Years | 19 to 29 Years | 30 to 39 Years | 40 to 49 Years | 50 to 59 Years | 60 to 69 Years | 70 to 79 Years | 80 plus Years | |
|---|---|---|---|---|---|---|---|---|
| 2022 | 7 | 15 | 12 | 4 | 2 | 0 | 0 | 1 |
| 2023 | 8 | 14 | 12 | 11 | 8 | 4 | 3 | 2 |
| 2024 | 7 | 15 | 12 | 10 | 5 | 3 | 1 | 0 |
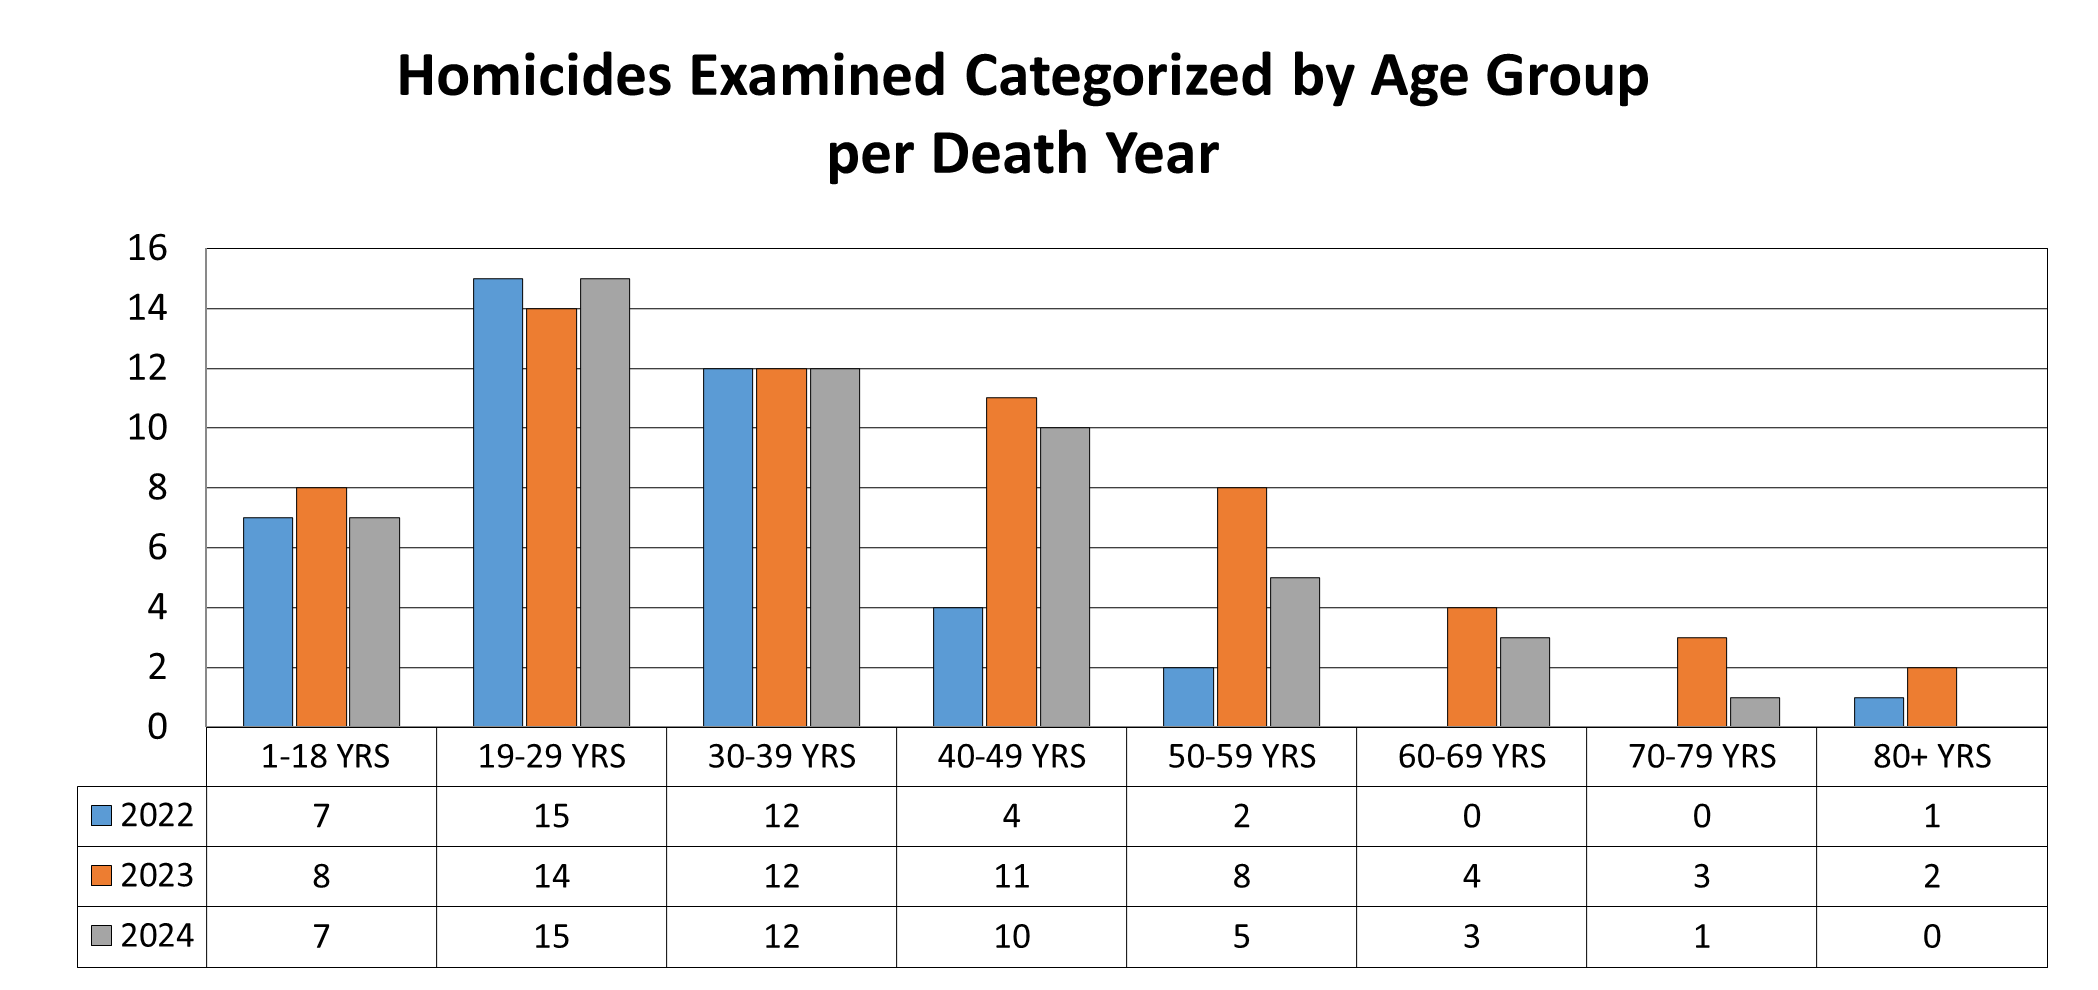
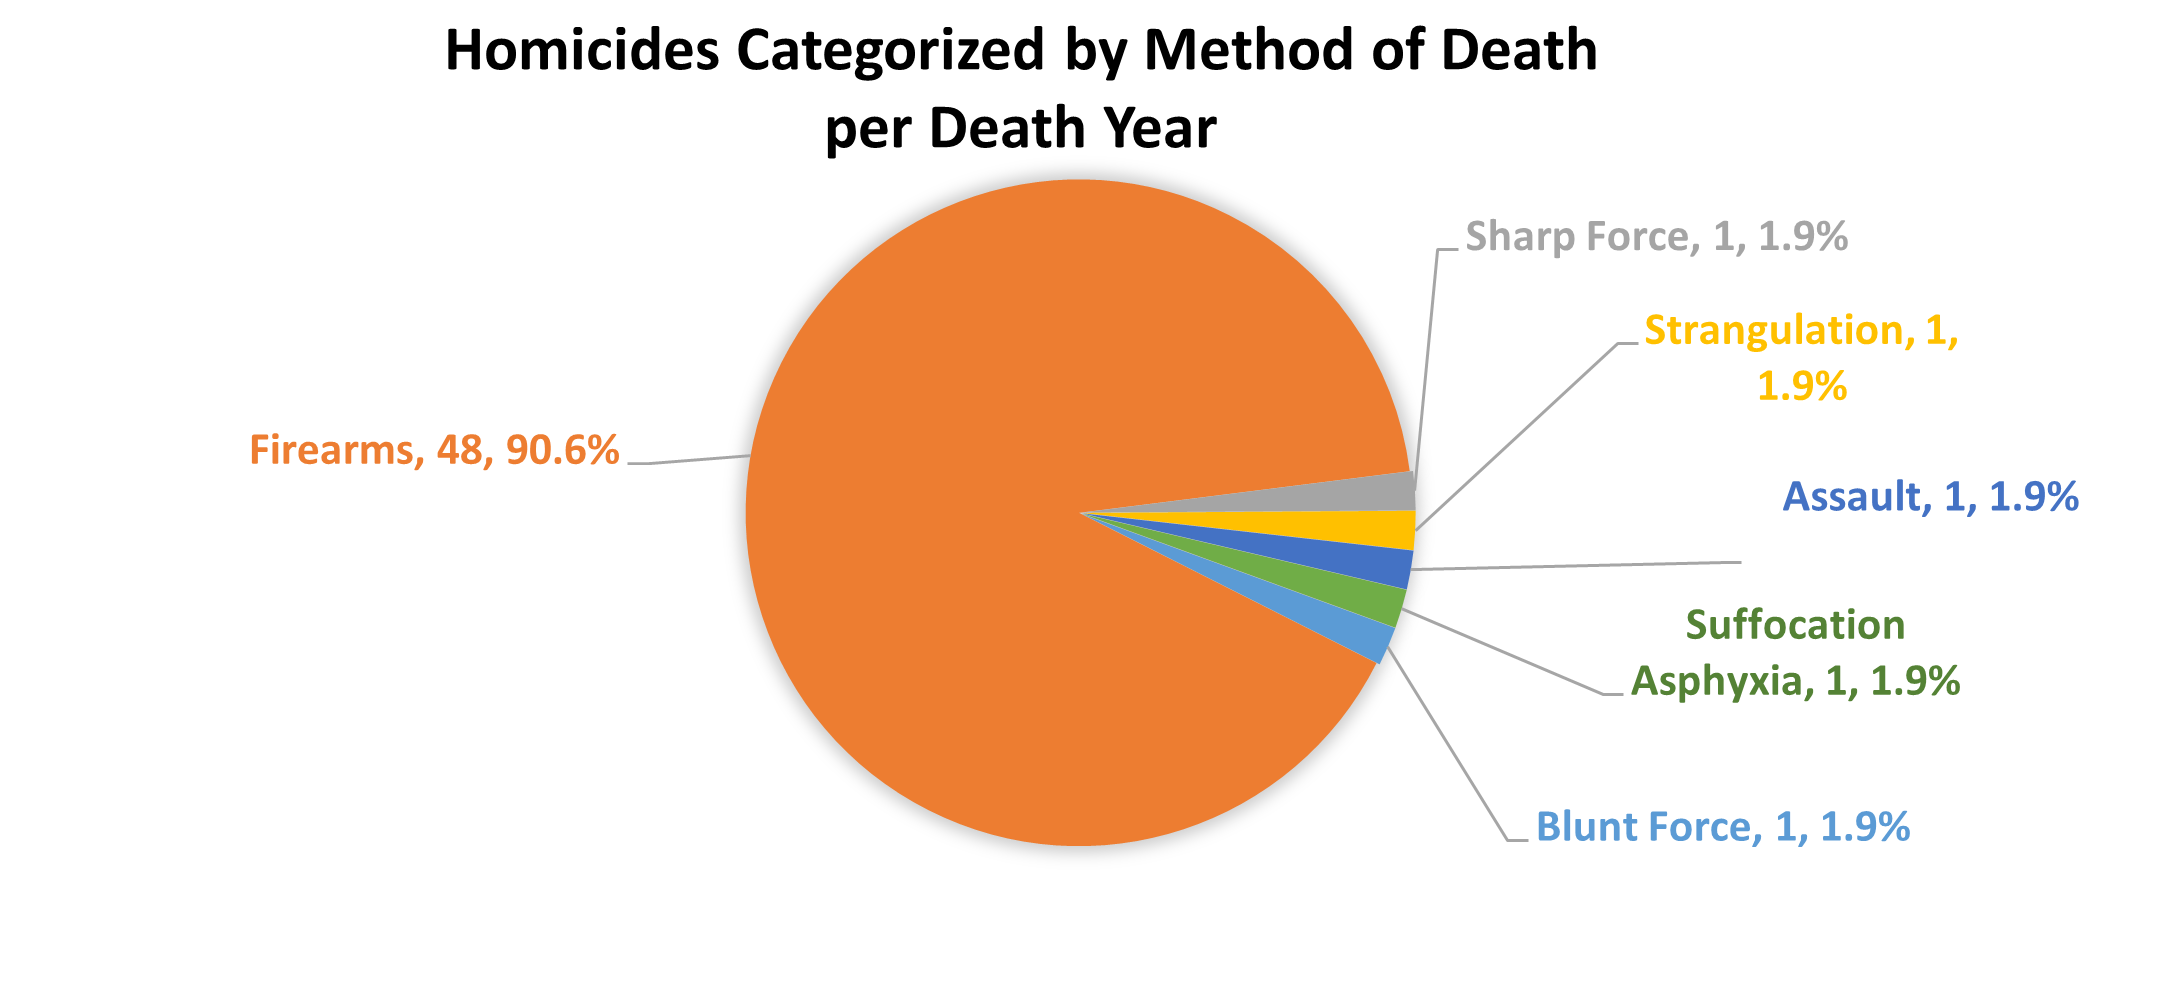
Figure 15 illustrates the percentage of homicides occurring in 2024 categorized by what was determined to be the cause of death. As depicted, most homicides were caused by the use of firearms.
| Firearms | Sharp Force | Strangulation | Assault | Suffocation Asphyxia | Blunt Force | |
|---|---|---|---|---|---|---|
| Number | 48 | 1 | 1 | 1 | 1 | 1 |
| Percent | 90.6 | 1.9 | 1.9 | 1.9 | 1.9 | 1.9 |
Suicides
There were 108 cases certified as suicide occurring in 2024. Figure 16 shows a range of 108 to 150 total suicides, representing various suicide rates, over the past 10 years.
| 2015 | 2016 | 2017 | 2018 | 2019 | 2020 | 2021 | 2022 | 2023 | 2024 | |
|---|---|---|---|---|---|---|---|---|---|---|
| Out of County | 34 | 35 | 33 | 37 | 32 | 34 | 34 | 29 | 20 | 16 |
| Sedgwick County | 74 | 99 | 96 | 102 | 94 | 115 | 96 | 111 | 96 | 92 |
| Total | 109 | 134 | 129 | 139 | 126 | 150 | 130 | 140 | 116 | 108 |
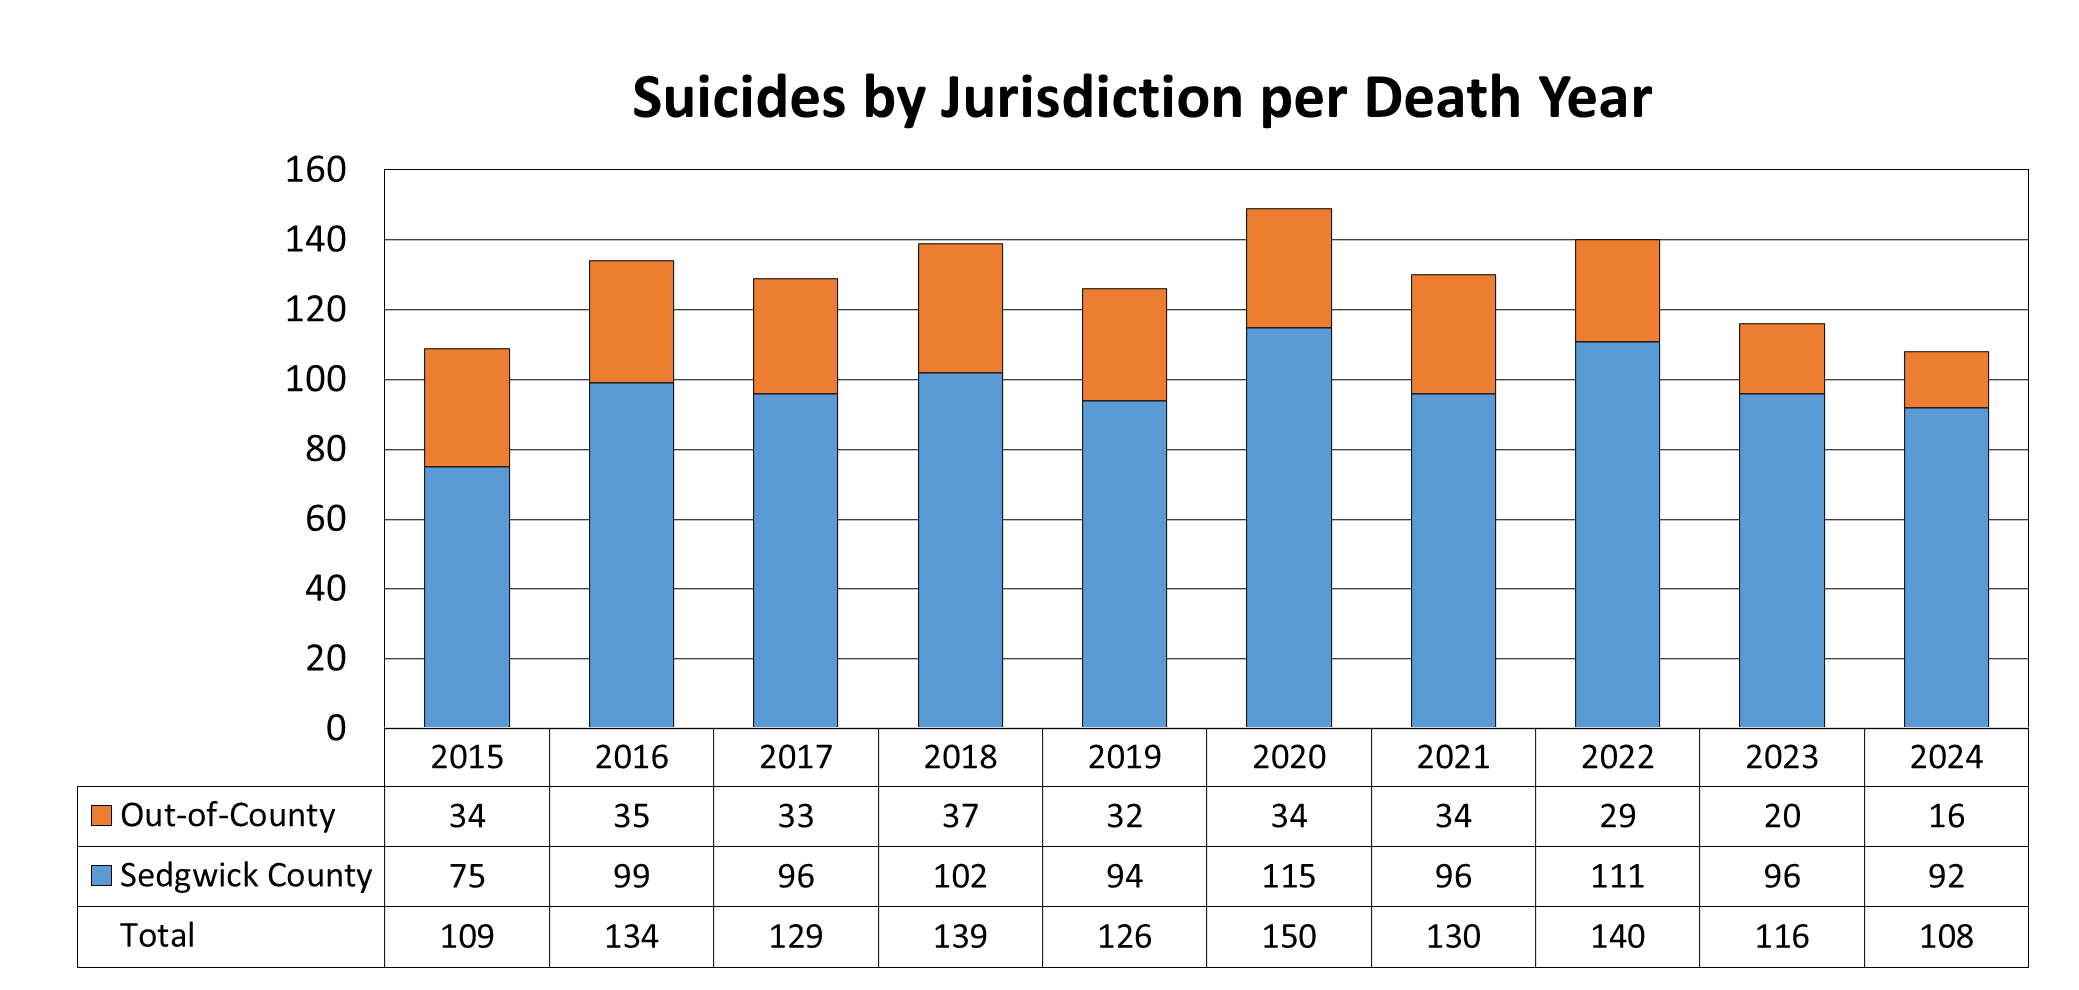
Figure 17 provides the percentage of suicides by gender per death year. In 2024, males committed approximately 76.85% of suicides and females committed 23.15%.
| Male | Female | |
|---|---|---|
| Number | 83 | 25 |
| Percent | 76.9 | 23.1 |
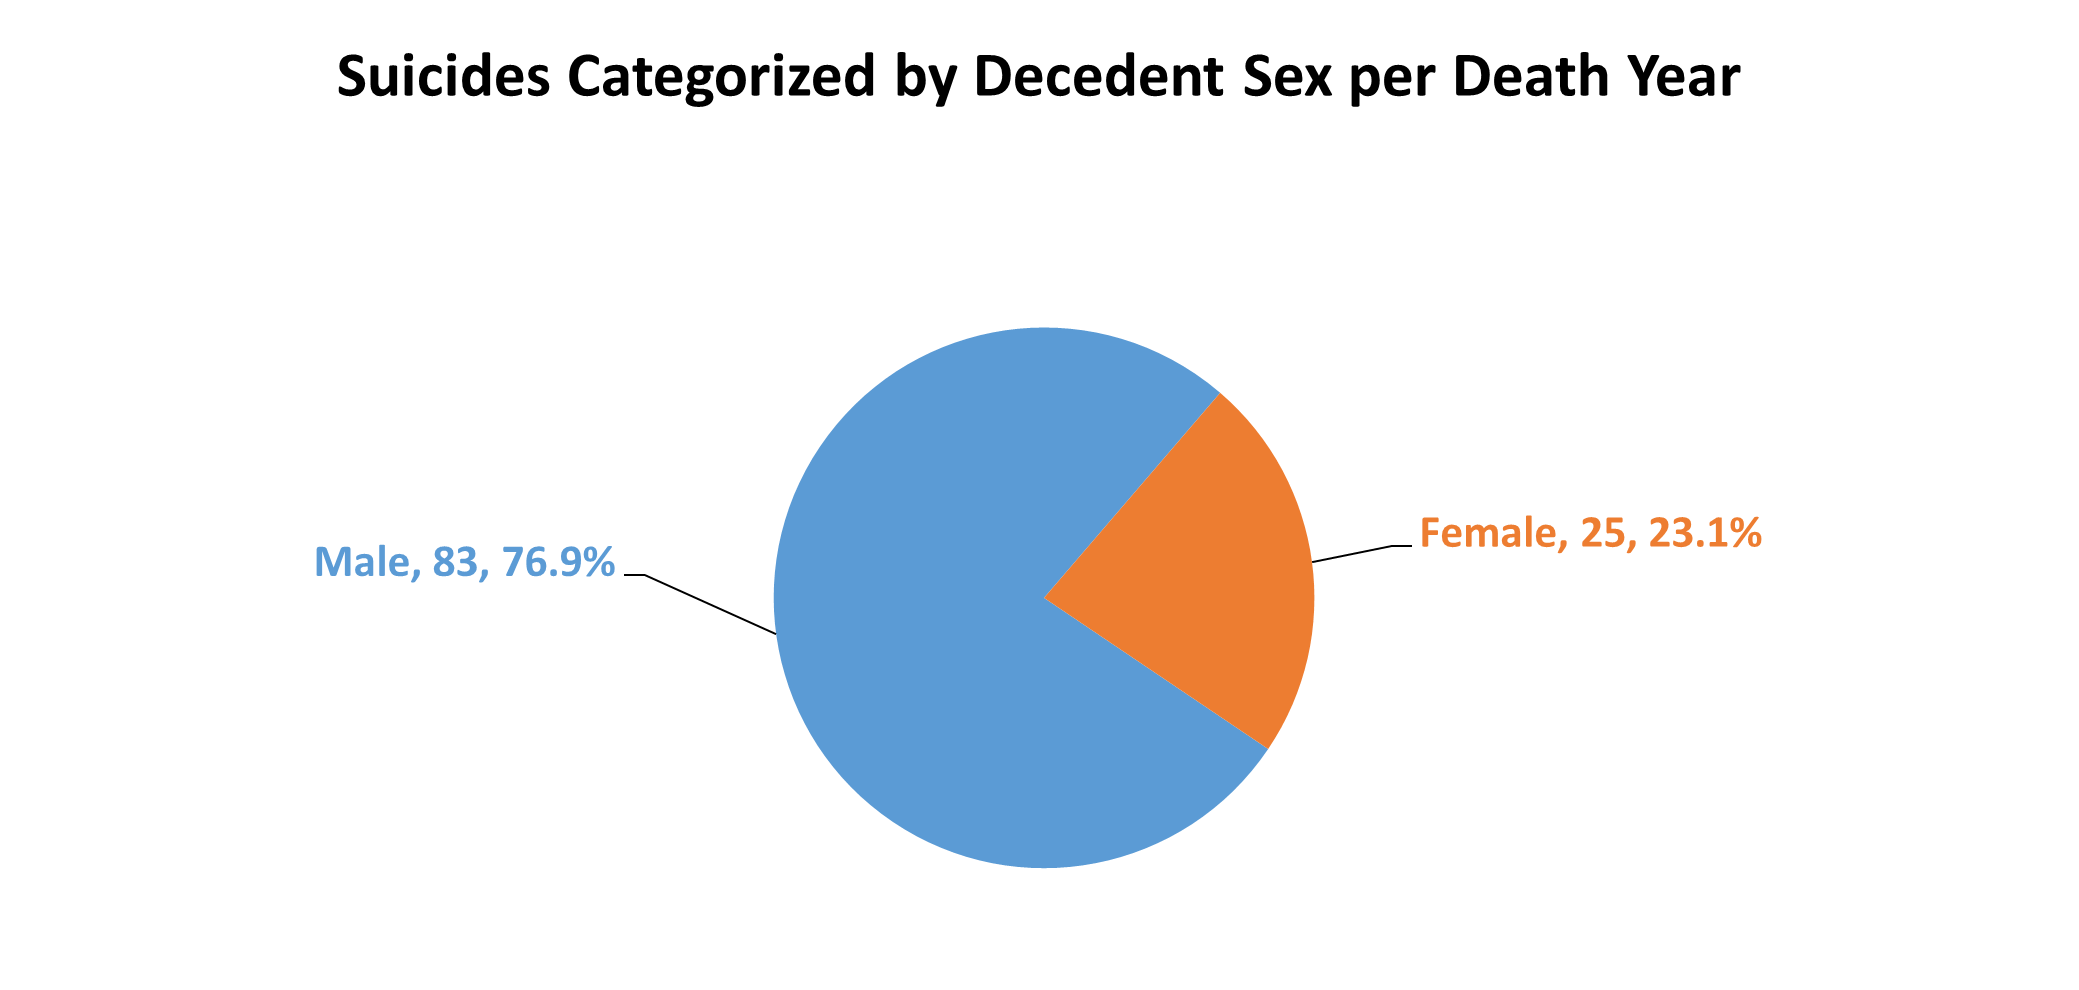
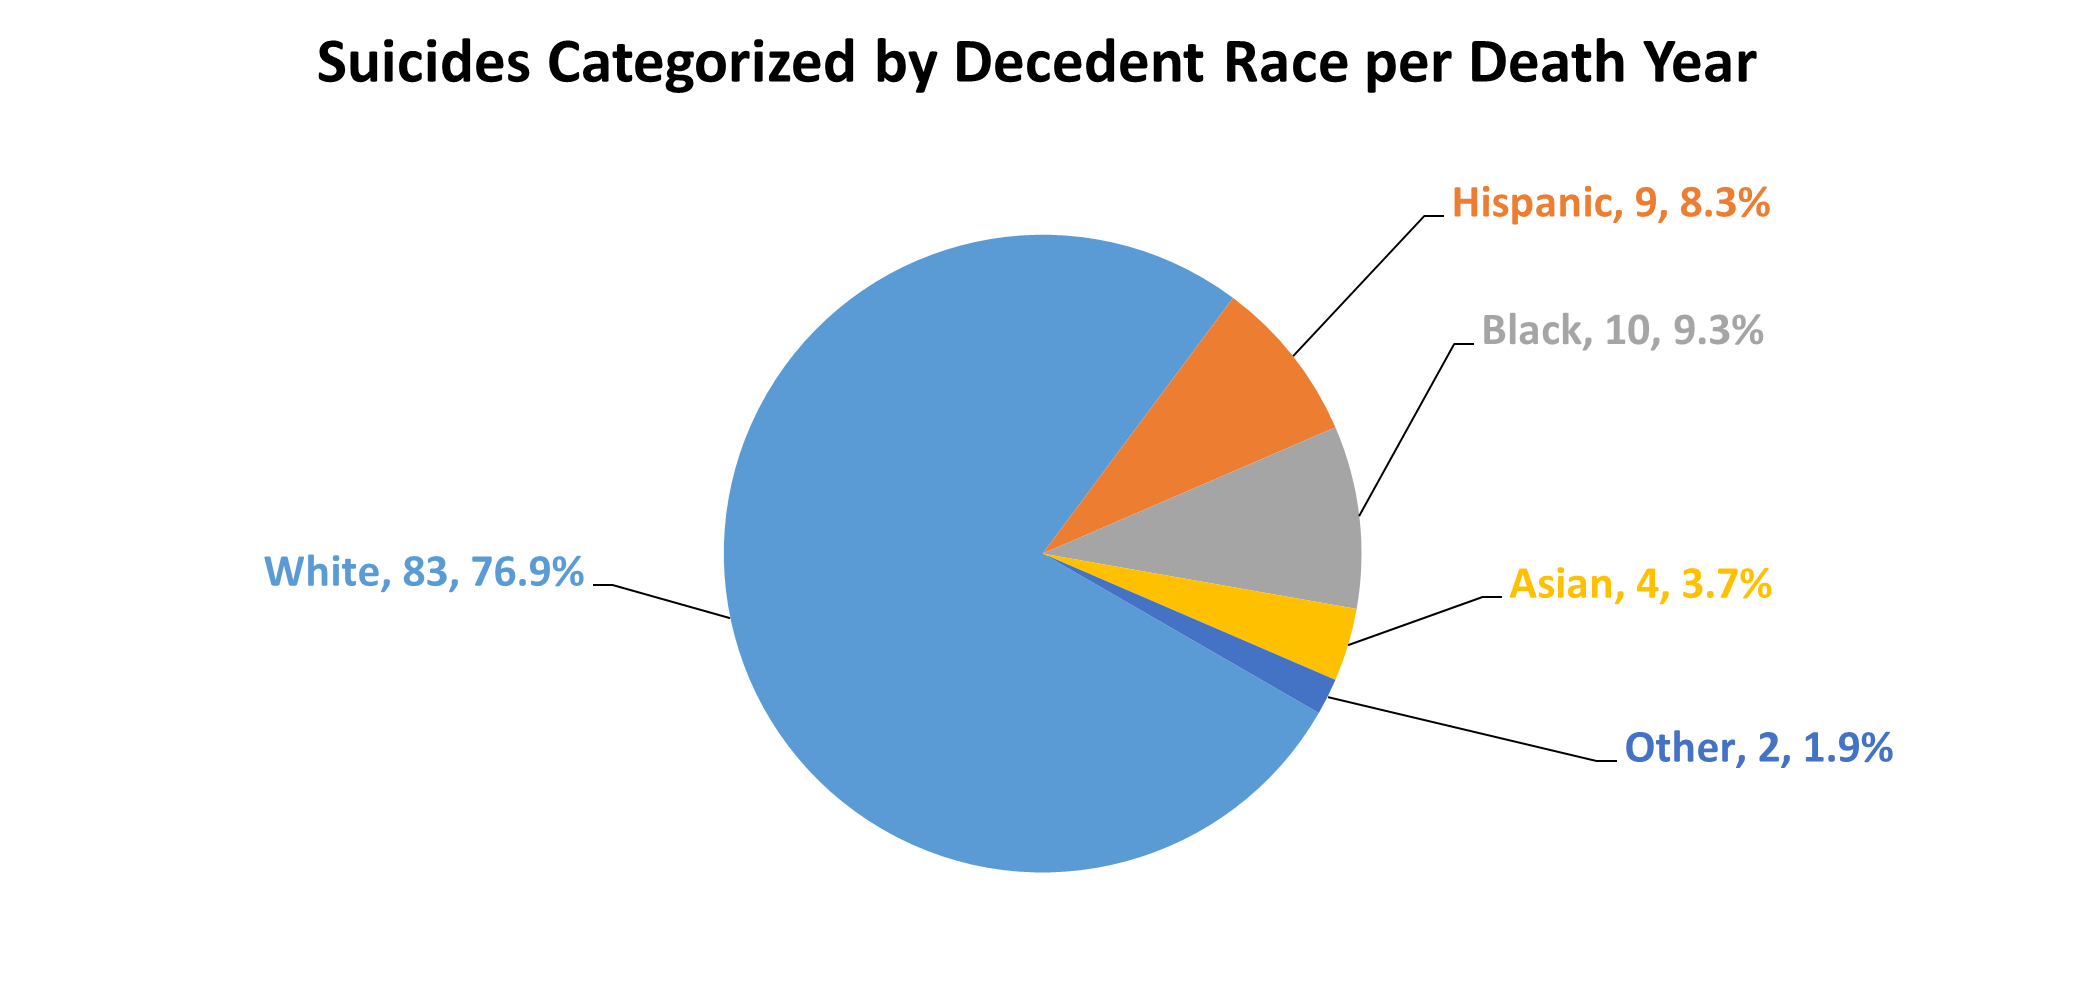
Figure 18 provides the percentage of 2024 suicides by race. The race that committed the greatest percentage of suicides is White.
| White | Hispanic | Black | Asian | Other | |
|---|---|---|---|---|---|
| Number | 83 | 9 | 10 | 4 | 2 |
| Percent | 76.9 | 8.3 | 9.3 | 3.7 | 1.9 |
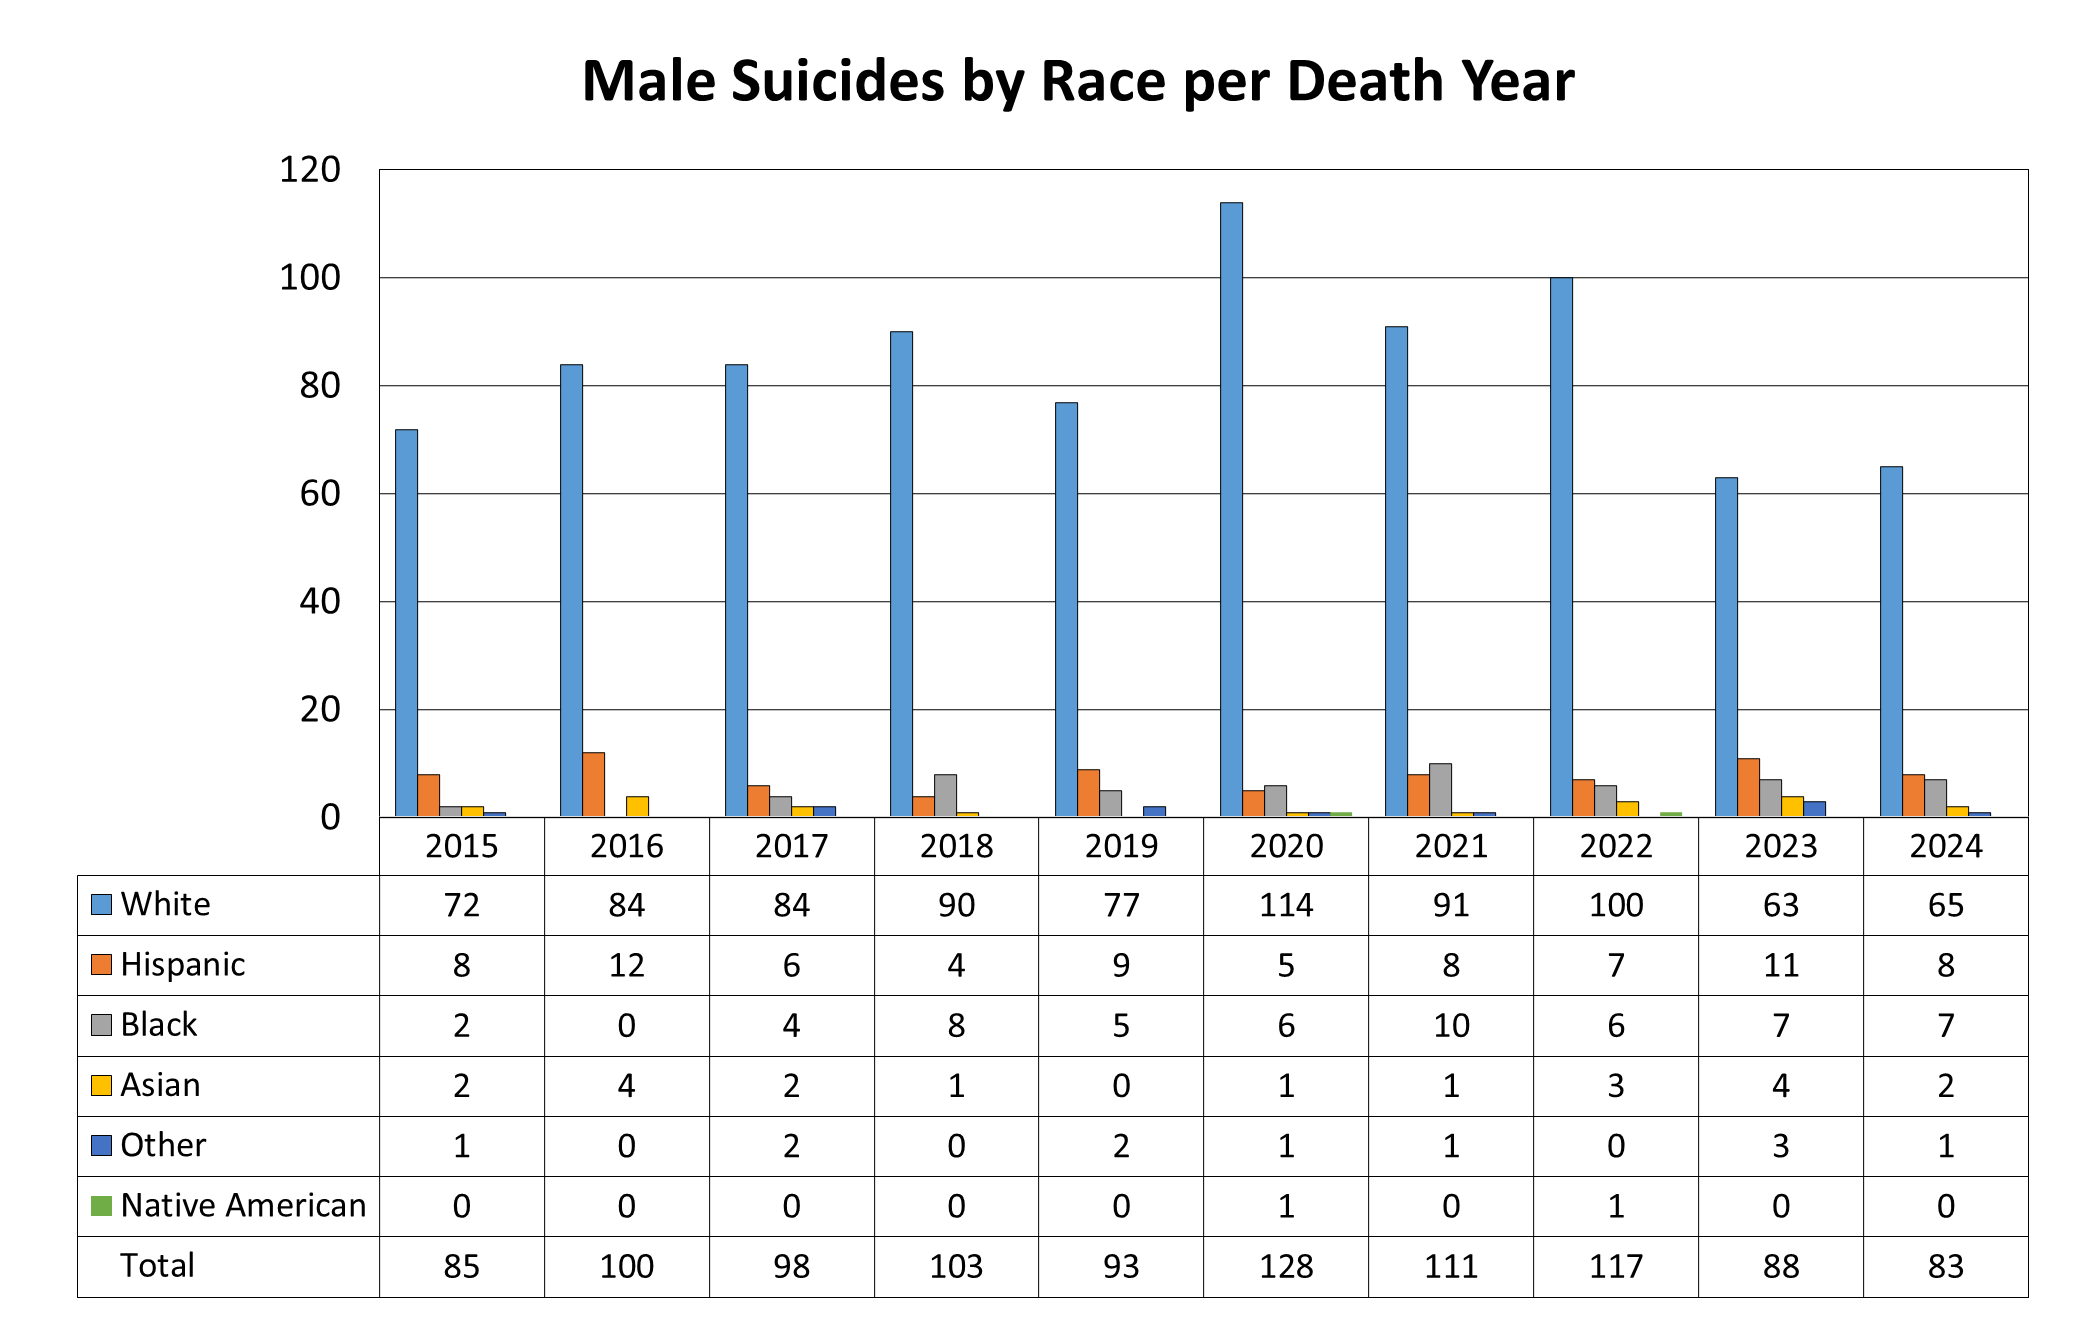
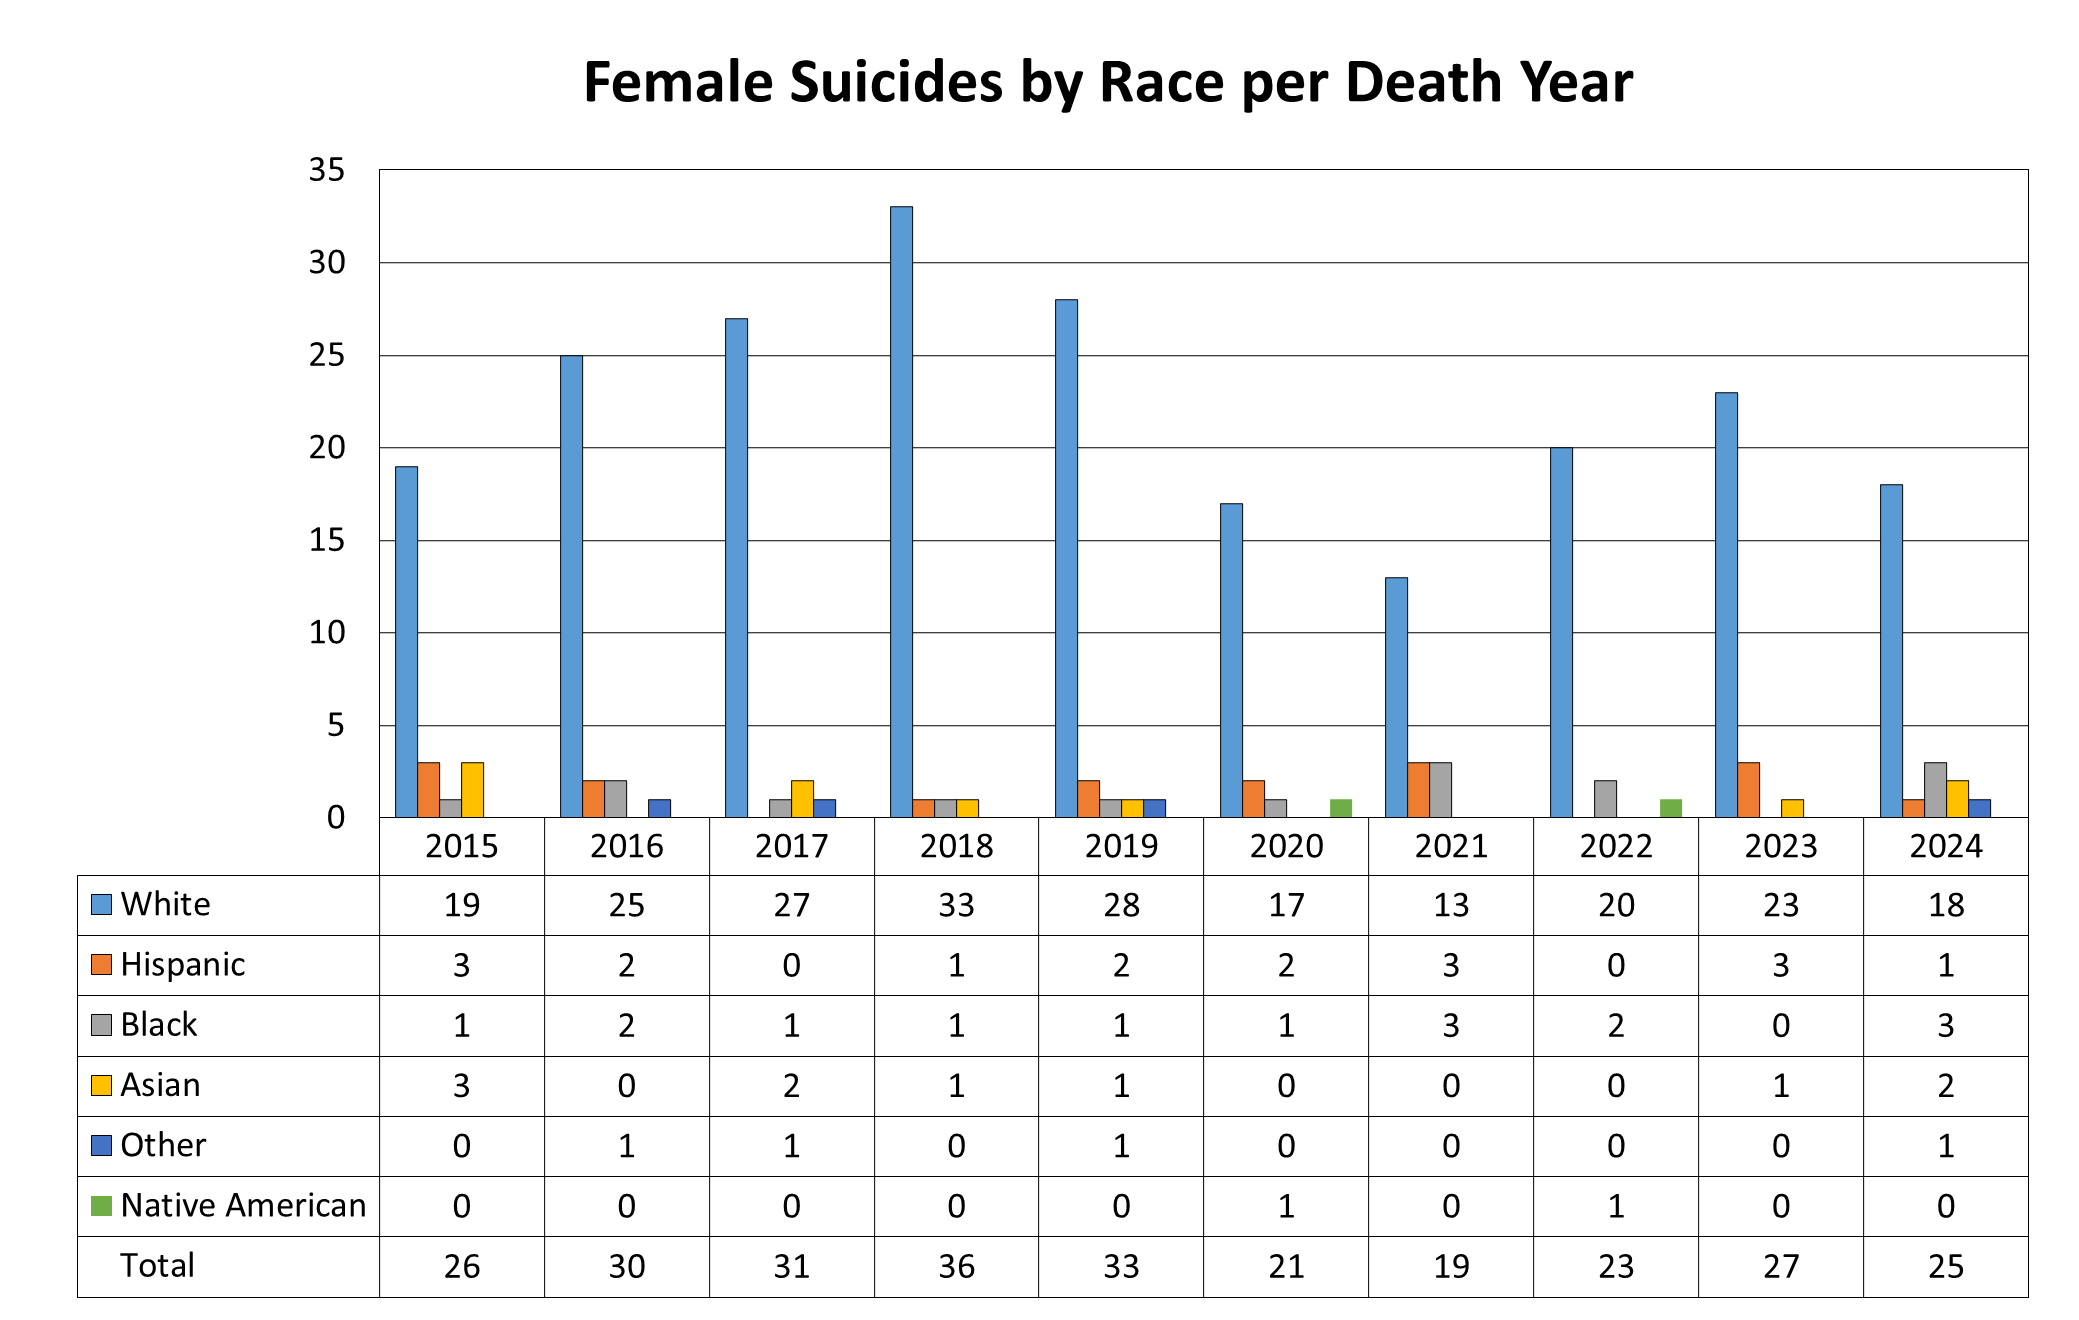
Figures 19 and 20 provide the number of suicides of each male and female, broken down by race per death year.
| 2015 | 2016 | 2017 | 2018 | 2019 | 2020 | 2021 | 2022 | 2023 | 2024 | |
|---|---|---|---|---|---|---|---|---|---|---|
| White | 72 | 84 | 84 | 90 | 77 | 114 | 91 | 100 | 63 | 65 |
| Hispanic | 8 | 12 | 6 | 4 | 9 | 5 | 8 | 7 | 11 | 8 |
| Black | 2 | 0 | 4 | 8 | 5 | 6 | 10 | 6 | 7 | 7 |
| Asian | 2 | 4 | 2 | 1 | 0 | 1 | 1 | 3 | 4 | 2 |
| Other | 1 | 0 | 2 | 0 | 2 | 1 | 1 | 0 | 3 | 1 |
| Native American | 0 | 0 | 0 | 0 | 0 | 1 | 0 | 1 | 0 | 0 |
| Total | 85 | 100 | 98 | 103 | 93 | 128 | 111 | 117 | 88 | 83 |
| 2015 | 2016 | 2017 | 2018 | 2019 | 2020 | 2021 | 2022 | 2023 | 2024 | |
|---|---|---|---|---|---|---|---|---|---|---|
| White | 19 | 25 | 27 | 33 | 28 | 17 | 13 | 20 | 23 | 18 |
| Hispanic | 3 | 2 | 0 | 1 | 2 | 2 | 3 | 0 | 3 | 1 |
| Black | 1 | 2 | 1 | 1 | 1 | 1 | 3 | 2 | 0 | 3 |
| Asian | 3 | 0 | 2 | 1 | 1 | 0 | 0 | 0 | 1 | 2 |
| Other | 0 | 1 | 1 | 0 | 1 | 0 | 0 | 0 | 0 | 1 |
| Native American | 0 | 0 | 0 | 0 | 0 | 1 | 0 | 1 | 0 | 0 |
| Total | 26 | 30 | 31 | 36 | 33 | 21 | 19 | 23 | 27 | 25 |
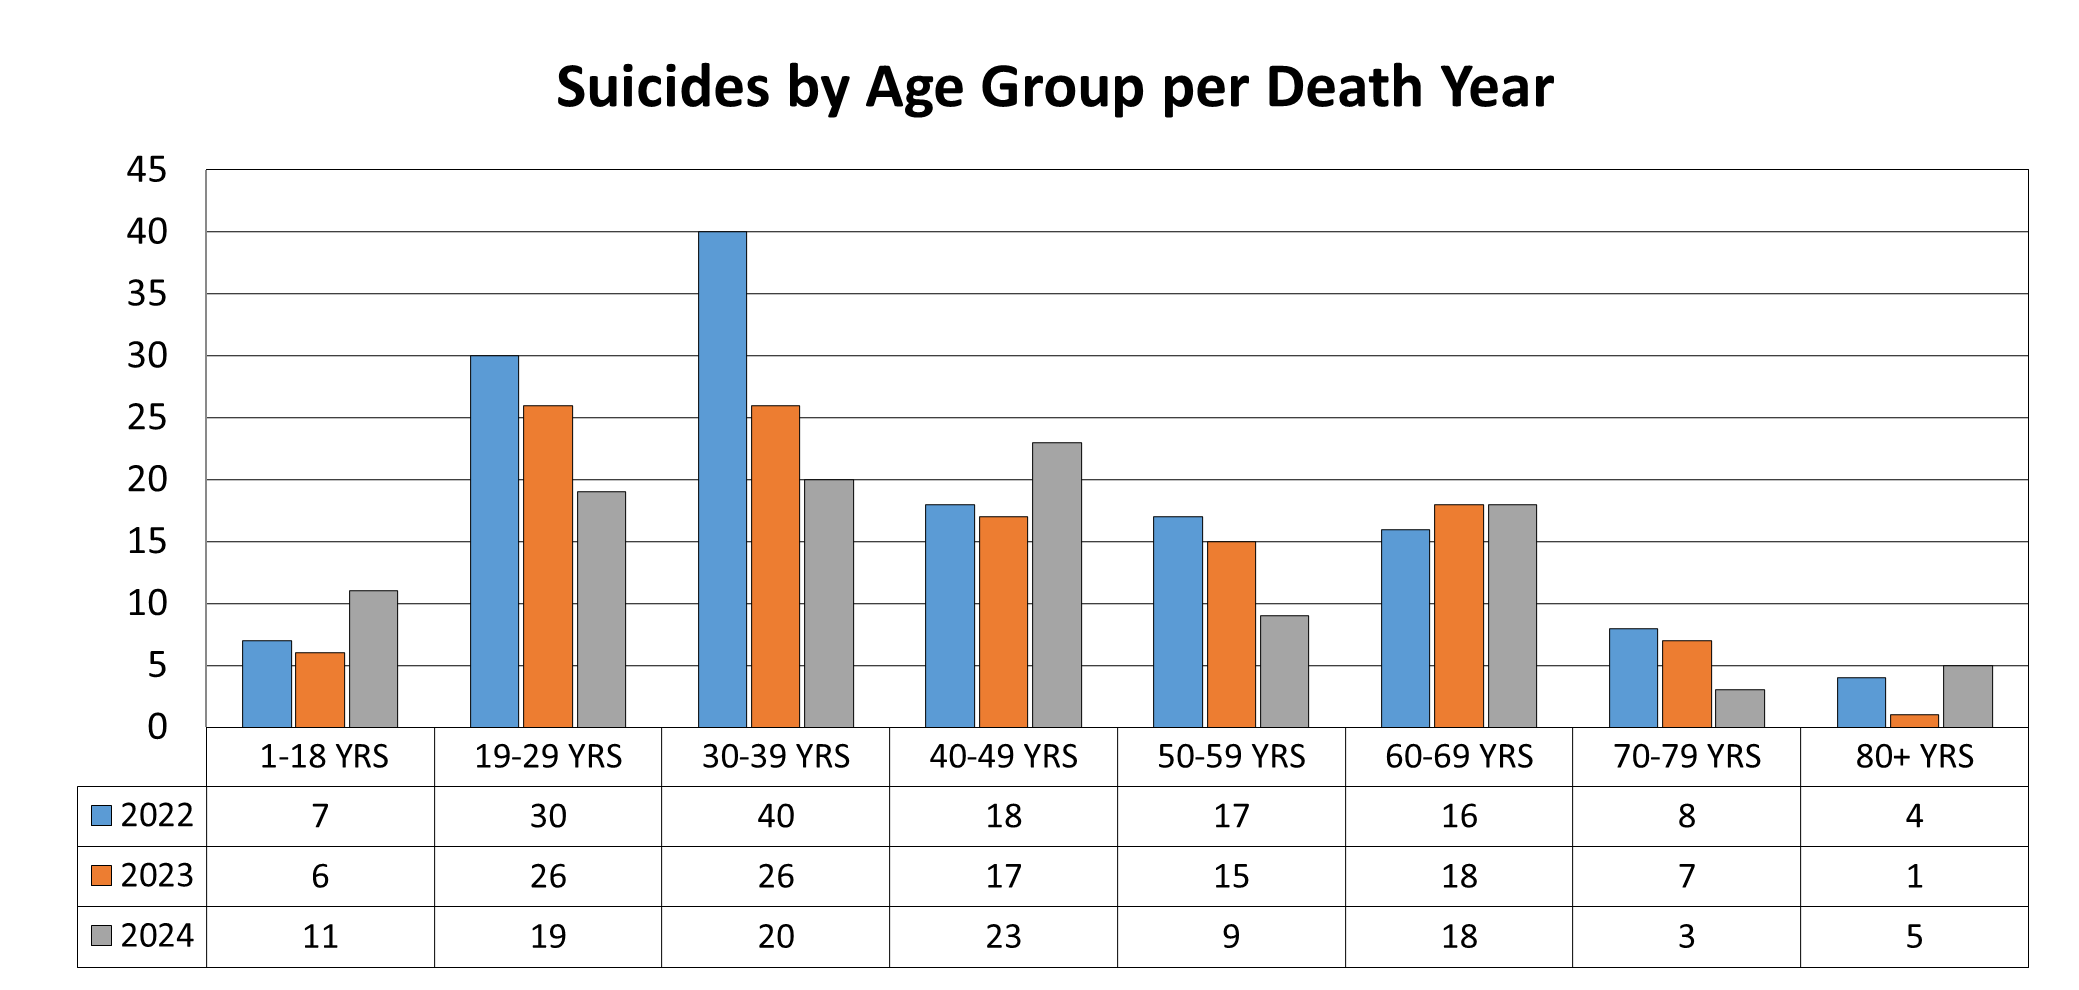
As shown in Figure 21, most 2024 suicides were committed by people between the ages of 40 to 49, with ages 19-29 and 30-39 close to follow.
| 1 to 18 Years | 19 to 29 Years | 30 to 39 Years | 40 to 49 Years | 50 to 59 Years | 60 to 69 Years | 70 to 79 Years | 80 plus Years | |
|---|---|---|---|---|---|---|---|---|
| 2022 | 7 | 30 | 40 | 18 | 17 | 16 | 8 | 4 |
| 2023 | 6 | 26 | 26 | 17 | 15 | 18 | 7 | 1 |
| 2024 | 11 | 19 | 20 | 23 | 9 | 18 | 3 | 5 |
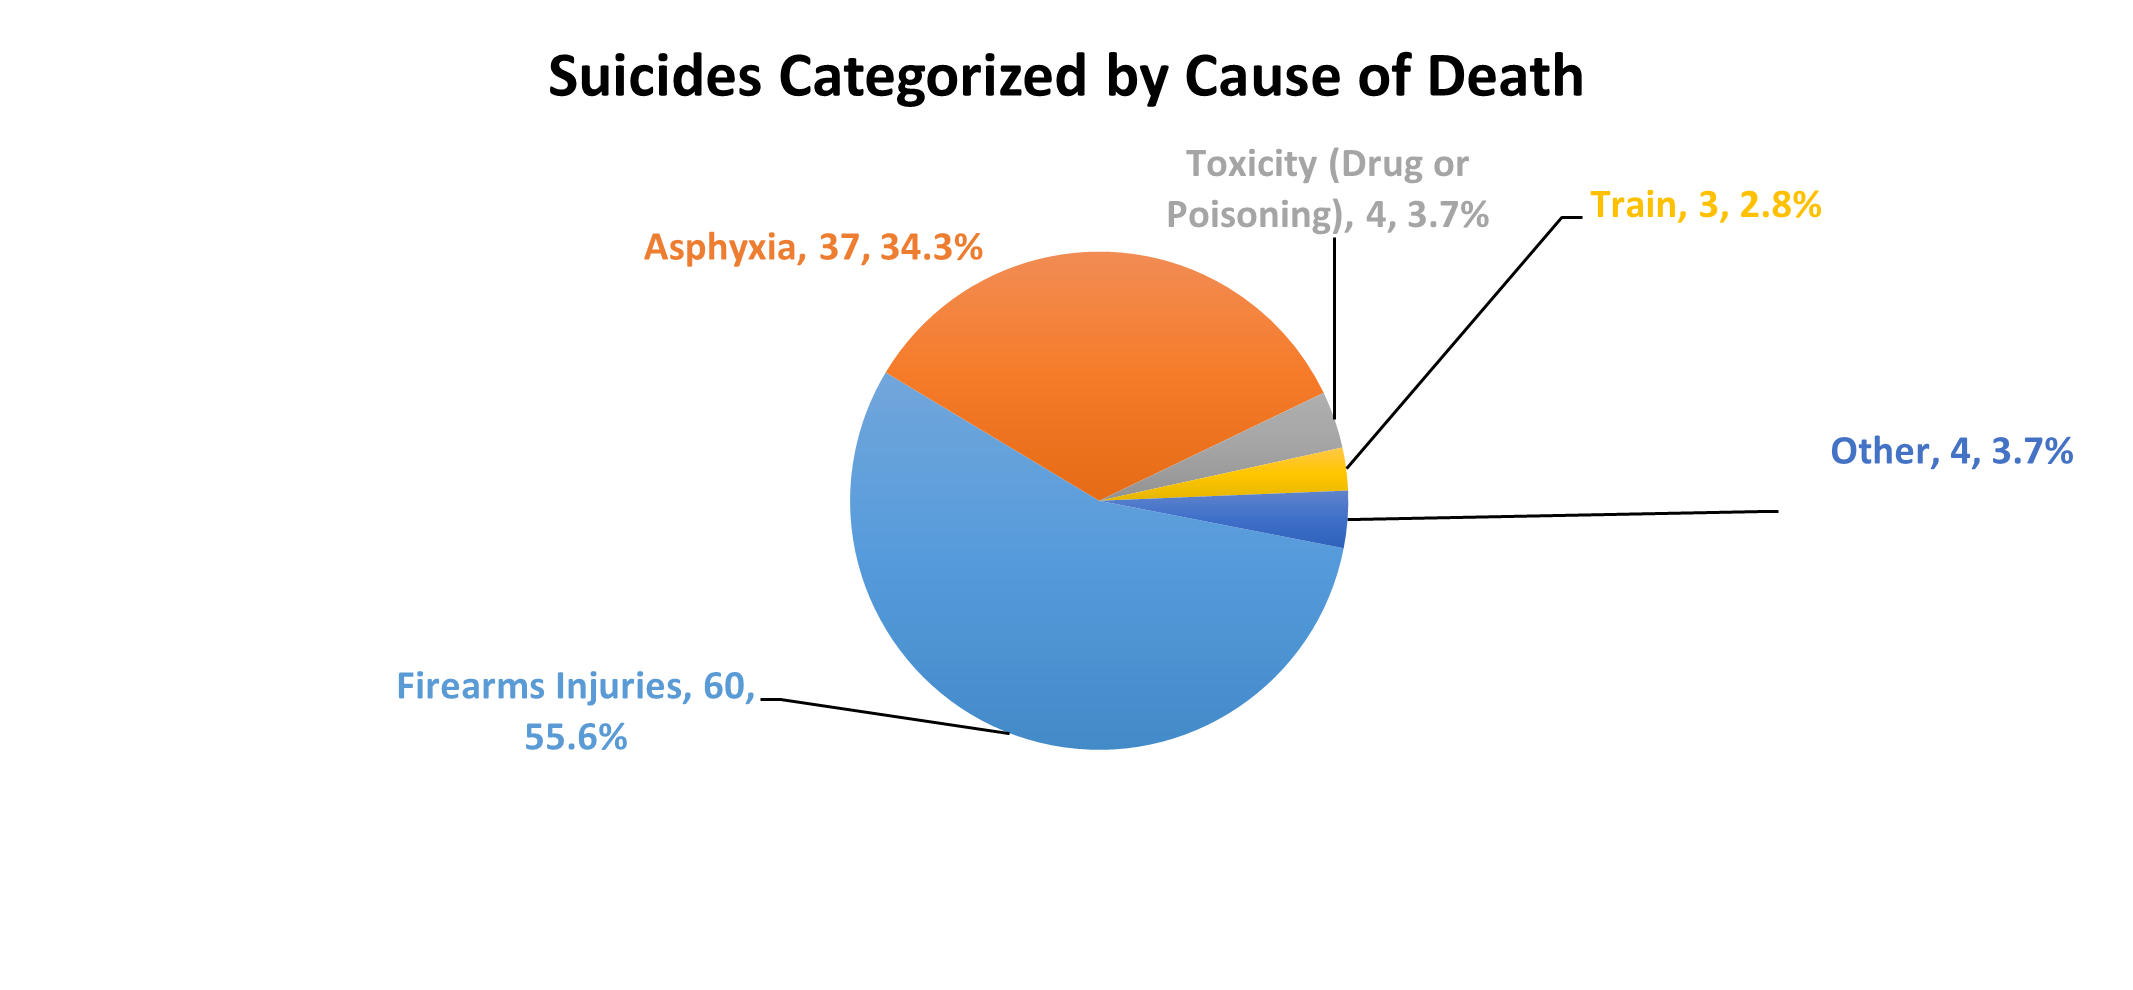
In 2024, the most common suicide method was use of firearms (60) followed by asphyxia (hanging, strangulation, suffocation, or CO poisoning) (37) [Figure 22]. The category of other includes drowning (1 count, or 0.9%), fire exposure (1 count, or 0.9%), and motor vehicle (2 count, or 1.9% ).
| Firearm Injuries | Asphyxia | Toxicity (Drug or Poisoning) | Train | Other | |
|---|---|---|---|---|---|
| Number | 60 | 37 | 4 | 3 | 4 |
| Percent | 55.6 | 34.3 | 3.7 | 2.8 | 3.7 |
Toxicology
The Toxicology Laboratory analyzes samples from deceased individuals to assist the case assigned Medical Examiner in determining the cause and manner of death by identifying the presence and quantity of toxic substances.
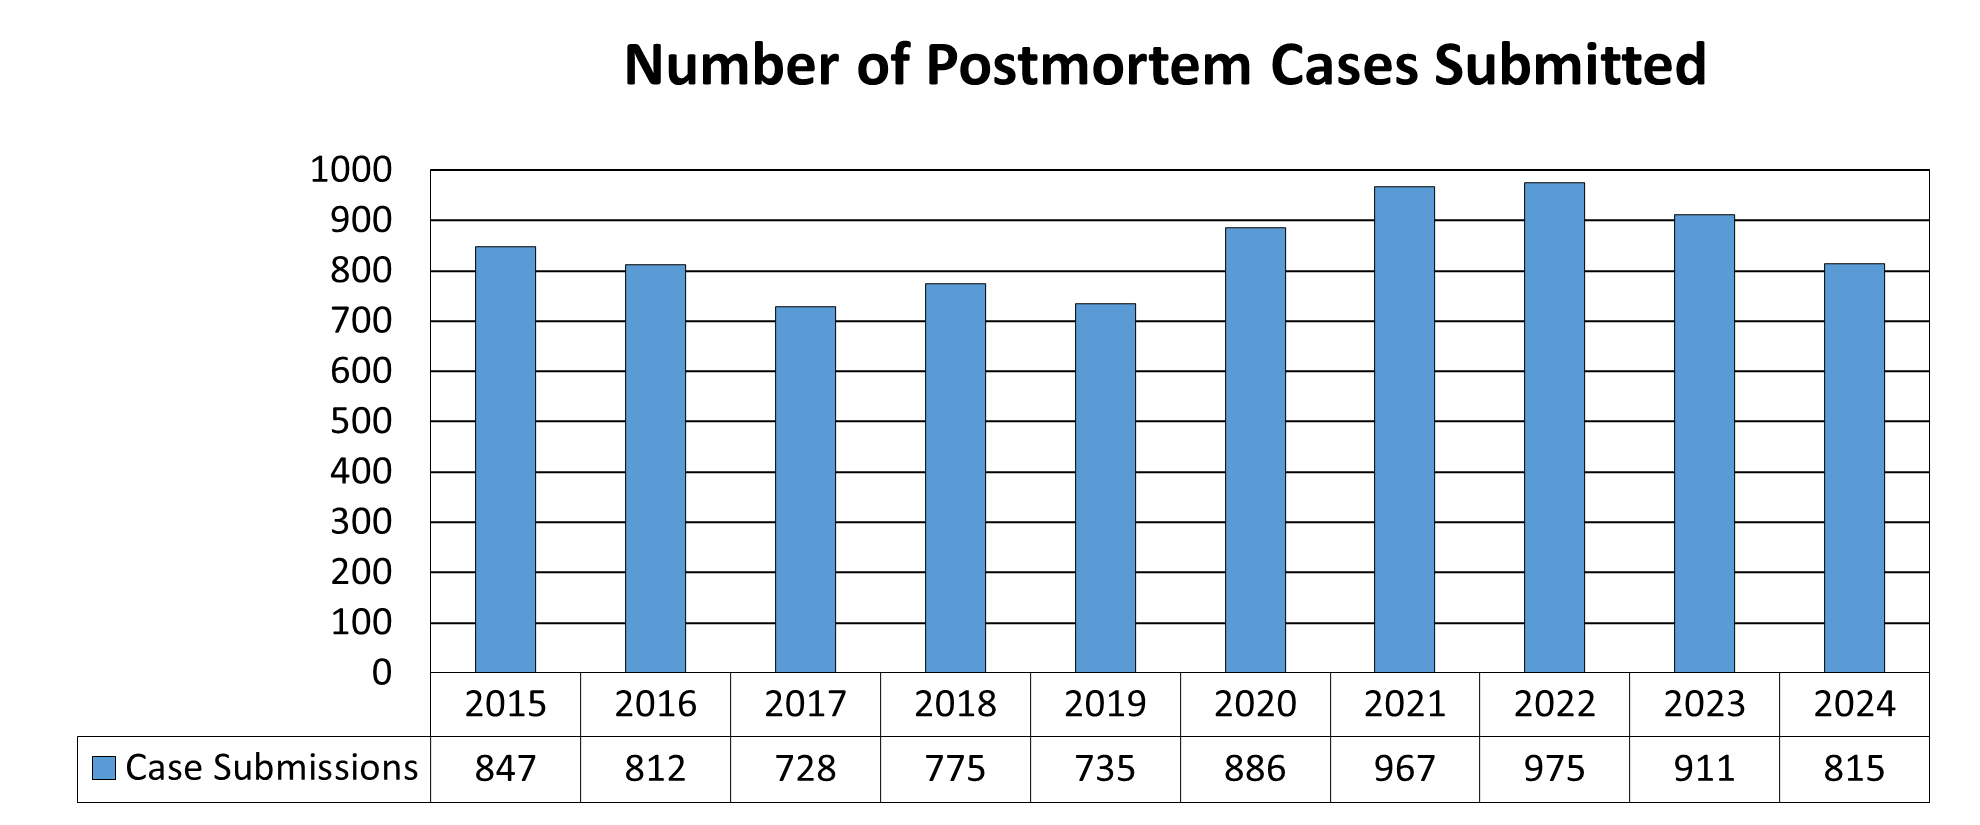
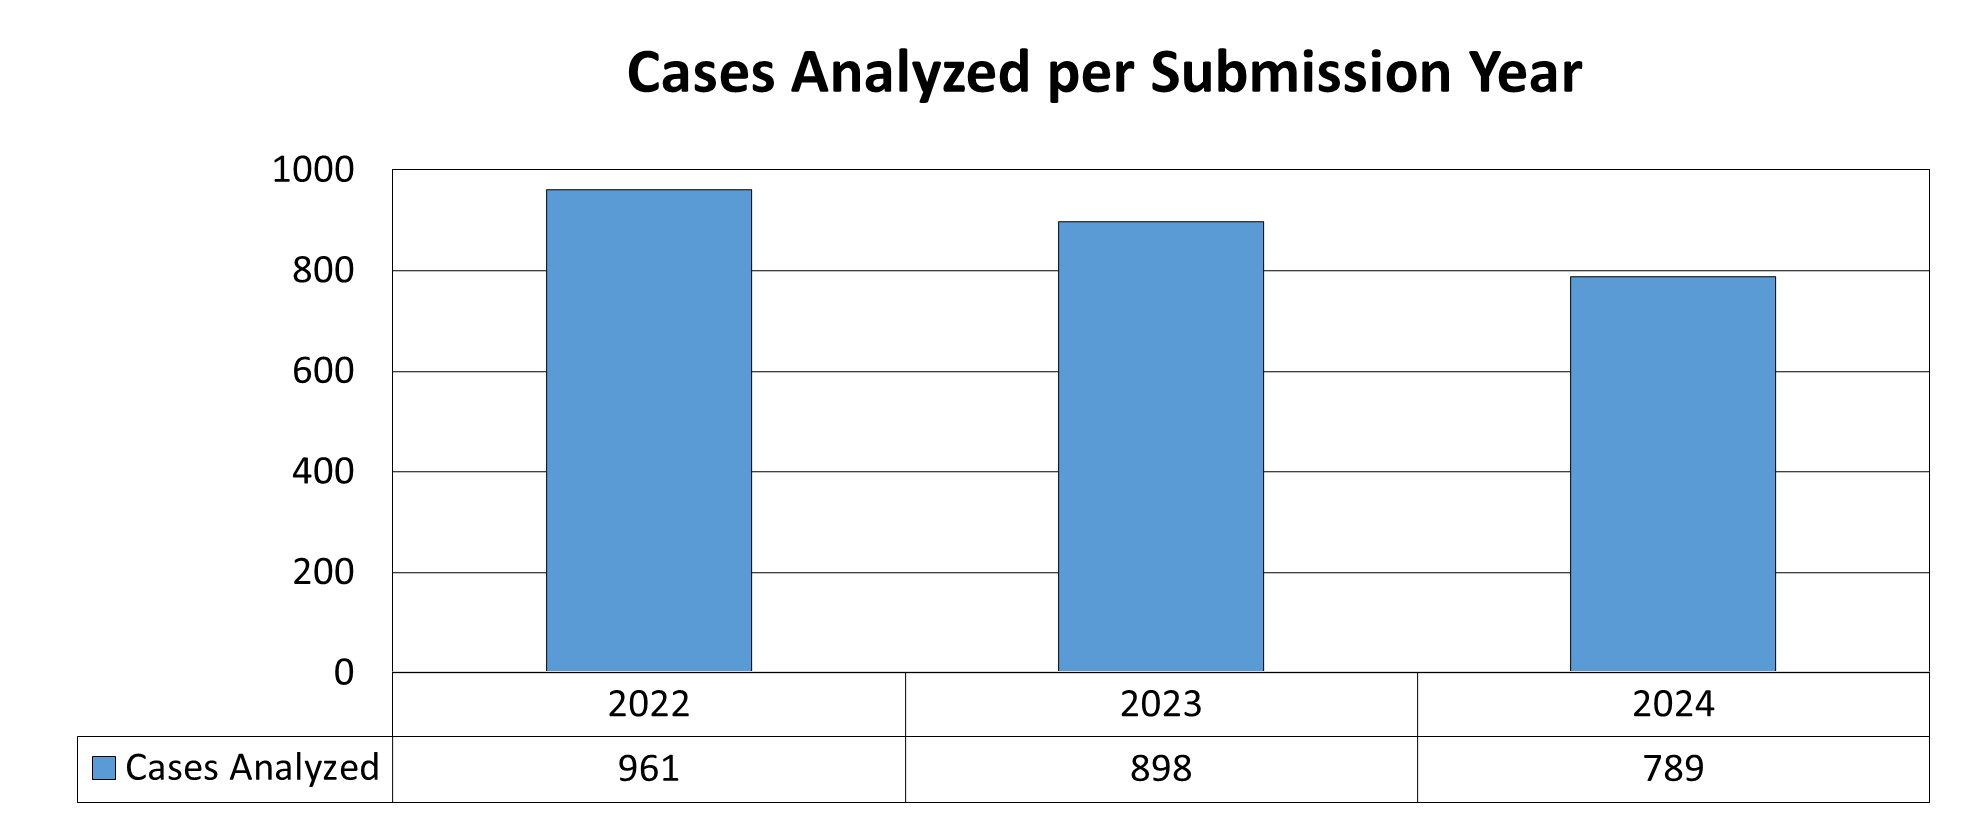
In 2024, there were 815 pathology cases submitted to the toxicology laboratory. The chart shows a range of 728 in 2017 to 975 in 2022 [Figure 23]. The laboratory analyzed 789 of the 815 submitted cases; the remaining 26 did not require toxicology testing [Figure 24].
| 2015 | 2016 | 2017 | 2018 | 2019 | 2020 | 2021 | 2022 | 2023 | 2024 | |
|---|---|---|---|---|---|---|---|---|---|---|
| Case Submission | 847 | 812 | 728 | 775 | 735 | 886 | 967 | 975 | 911 | 815 |
| 2022 | 2023 | 2024 | |
|---|---|---|---|
| Cases Analyzed | 961 | 898 | 789 |
Drivers
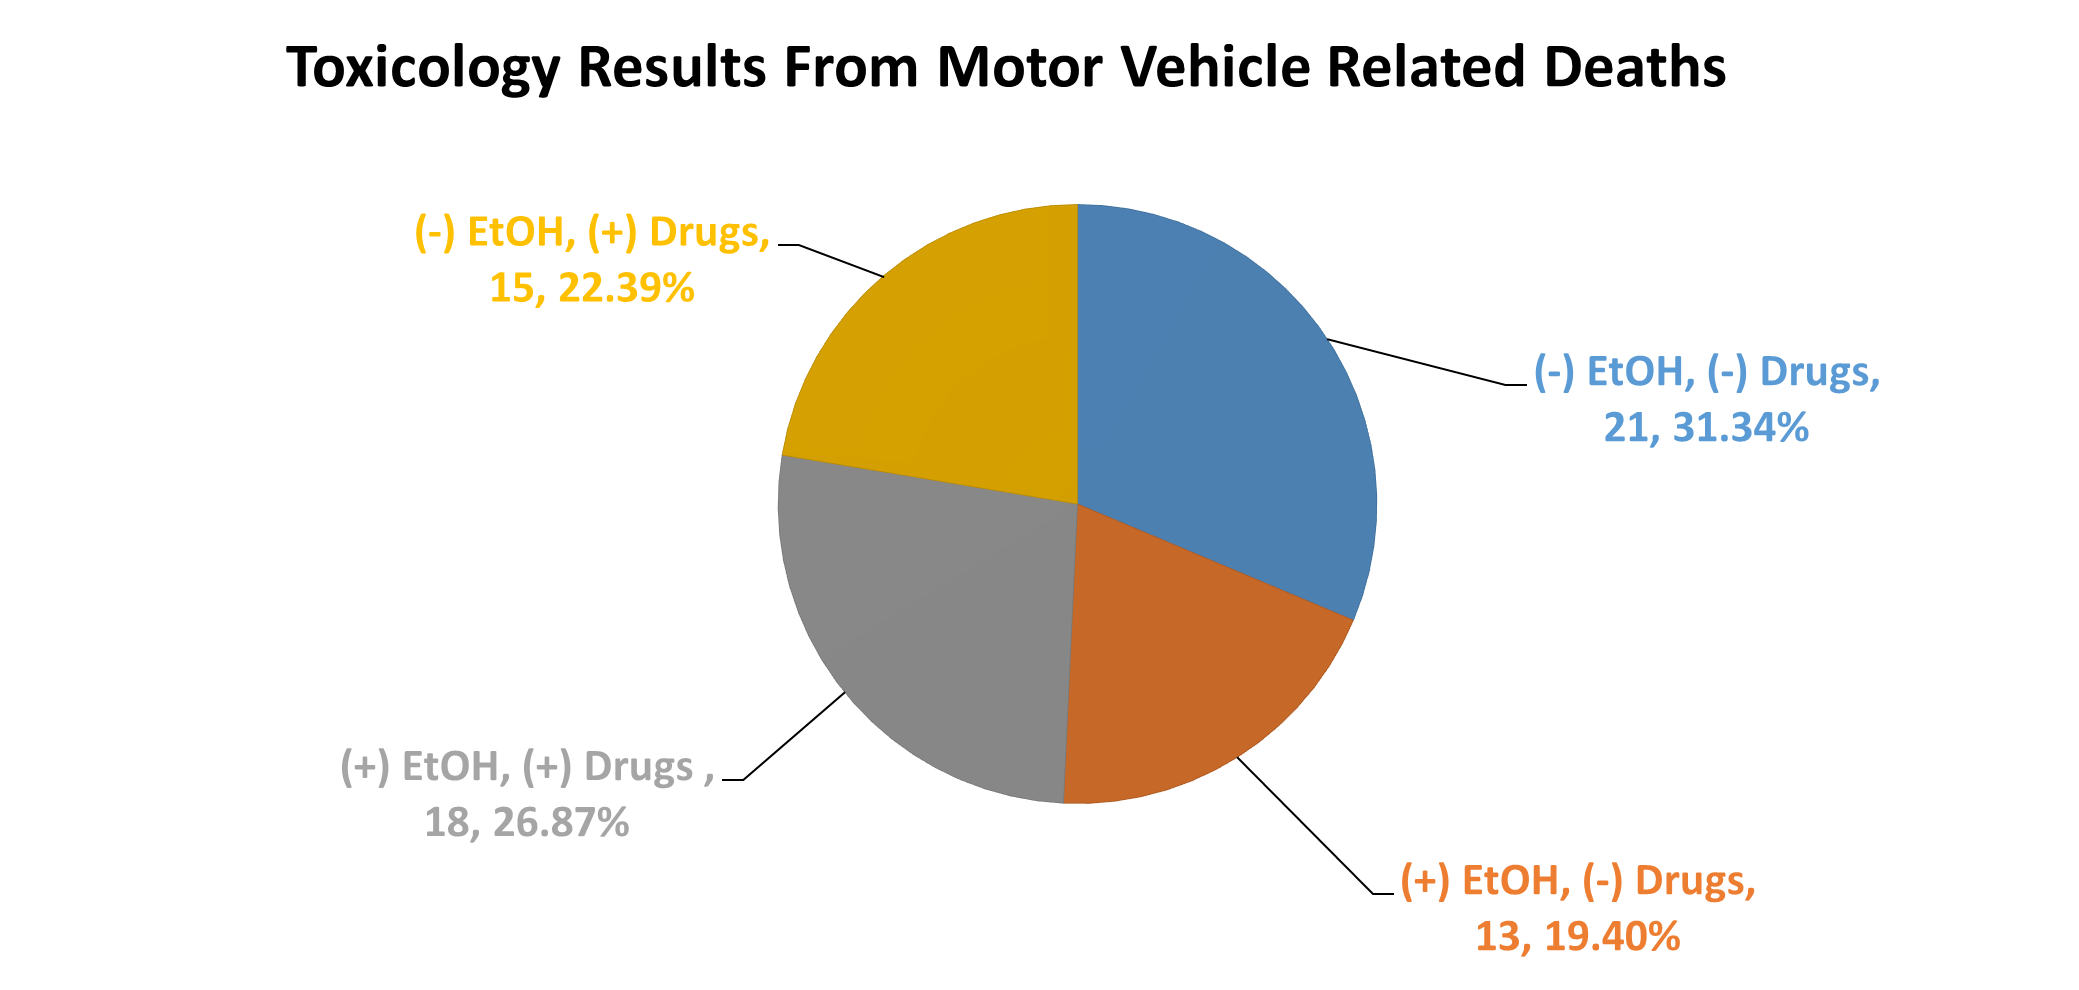
In 2024, there were specimens from 71 postmortem cases submitted for analysis to the toxicology laboratory from decedents of motor vehicle related deaths. Figure 25 depicts the results of testing for ethanol (EtOH) and drugs from the 67 cases that were examined.
Fifteen (15) decedents from motor vehicle related deaths tested positive for drugs with no EtOH detected, 13 were positive for EtOH with no drugs detected, 18 were positive for EtOH and drugs, and in 21 decedents neither EtOH nor drugs were detected. Additionally, there were 4 vehicle-related cases that did not undergo toxicological testing.
| Positive Ethanol and Positive Drugs | Negative Ethanol and Positive Drugs | Negative Ethanol and Negative Drugs | Positive Ethanol and Negative Drugs | |
|---|---|---|---|---|
| Number | 18 | 15 | 21 | 13 |
| Percent | 26.87 | 22.39 | 31.34 | 19.40 |
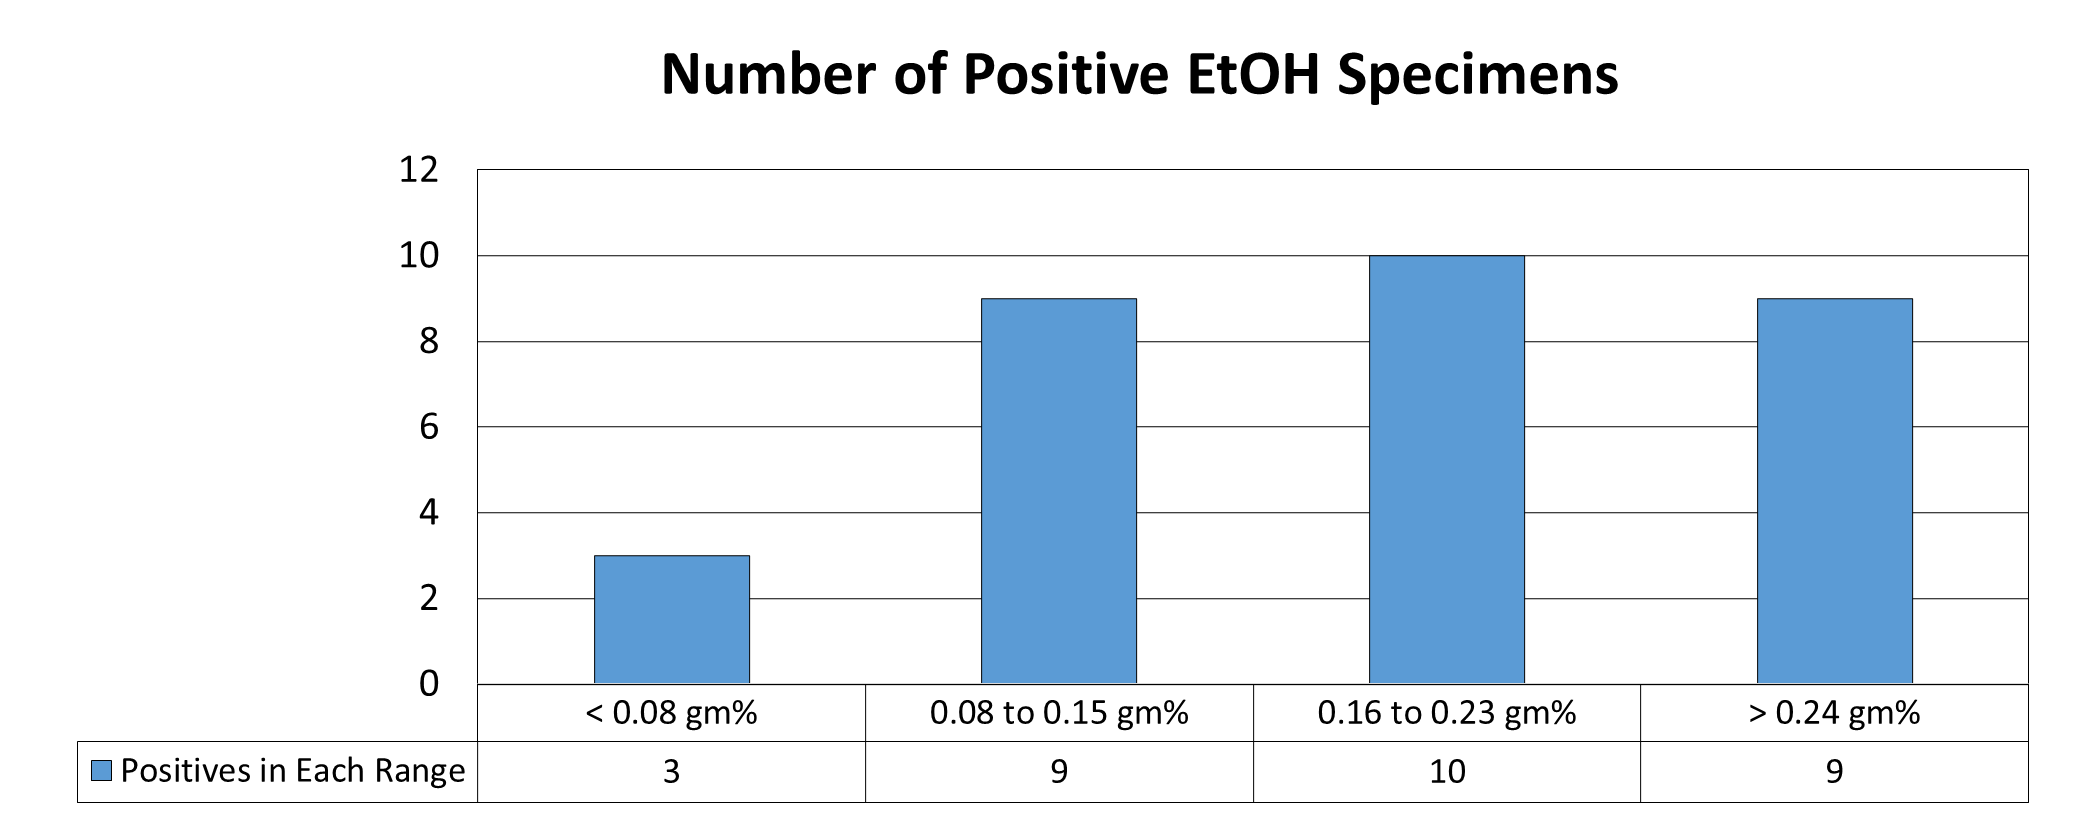
Of the EtOH positive blood specimens [Figure 26], the vast majority exceeded the legal limit of 0.08 gm%. The highest blood alcohol result was 0.338 gm%.
| < 0.08-gram percent | 0.08-to-0.15-gram percent | 0.16-to-0.23-gram percent | > 0.24-gram percent | |
|---|---|---|---|---|
| Number of Positives in Each Range | 3 | 9 | 10 | 9 |
Drug Related Deaths
Drug related deaths is a general term for deaths caused by drug use. These deaths may include, but are not necessarily limited to, overdoses, deliberate poisonings, accidental poisonings, suicides, health issues related to drug use, deaths due to accidents, or other deaths where a drug is detected in a postmortem specimen.
In drug related deaths, it is very common for the Toxicology Laboratory to detect opioids, methamphetamine, and/or a benzodiazepine in the specimens collected at autopsy or at the hospital prior to death. These drugs are especially common in cases determined to be overdoses, although they are not necessarily detected in every case.
Of particular interest for public health and public safety are overdose deaths and other death types that had either an opioid, methamphetamine, or a benzodiazepine detected. Information about these are provided below.
Overdoses
Overdose deaths are a type of drug related death that can be either accidental or intentional. In 2024, there were a total of 190 overdose fatalities, which equates to an approximate 48.4% increase since 2015 [Figure 27]. However, in 2024 the number of these case types decreased by approximately 36.2% compared to 2021 [Figure 27].
| 2015 | 2016 | 2017 | 2018 | 2019 | 2020 | 2021 | 2022 | 2023 | 2024 | |
|---|---|---|---|---|---|---|---|---|---|---|
| Overdoses | 128 | 111 | 115 | 128 | 139 | 195 | 298 | 293 | 243 | 190 |
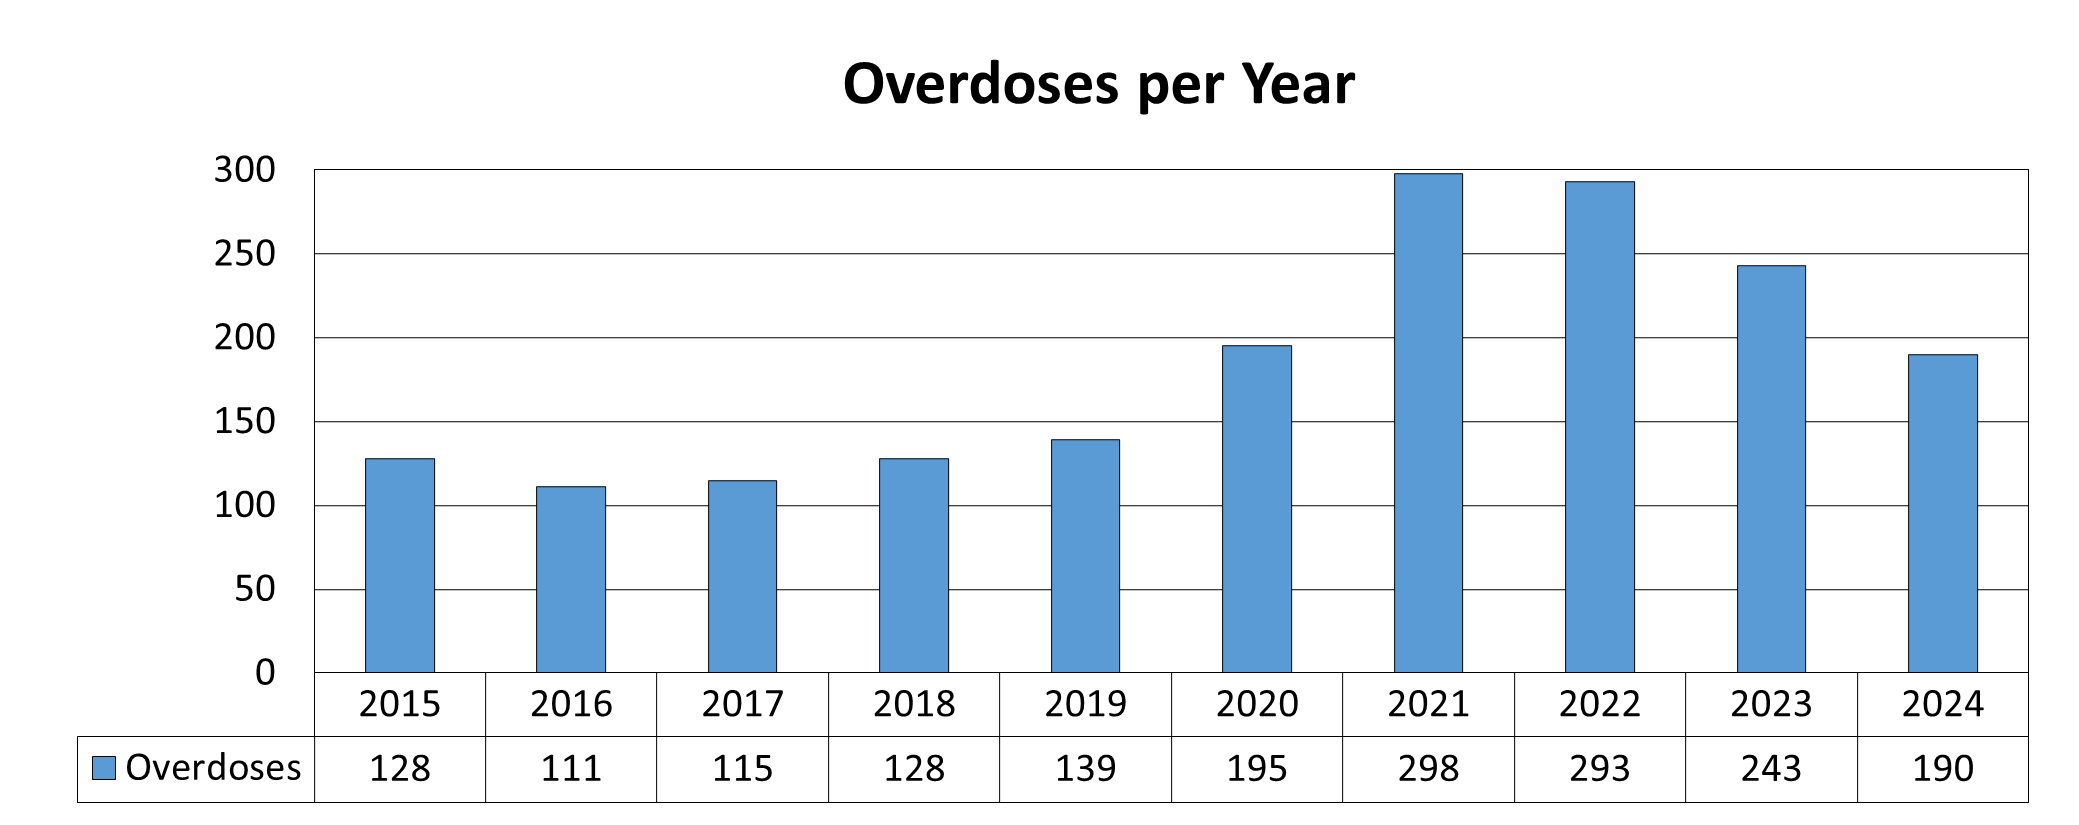
Table 2 illustrates the count of overdose deaths in 2024 within various age groups. The greatest number of overdose deaths occurred in the 30- to 39-year-old age group.
| Age Group | Number of Deaths (All Counties) | Number of Deaths (Sedgwick County) |
|---|---|---|
| 0-18 | 3 | 3 |
| 19-29 | 25 | 22 |
| 30-39 | 62 | 60 |
| 40-49 | 39 | 36 |
| 50-59 | 39 | 38 |
| 60-69 | 21 | 20 |
| 70-79 | 1 | 1 |
Opioid Positive Postmortem Cases
Deaths where an opioid was detected were at an all-time high in 2022 with a total of 298 (previous high was 259 in 2021); however, cases continued to trend downward in 2024 with a total of 202. The range of opioid positive postmortem cases over the past 10 years is 136 to 298 with an average of approximately 192. Figure 28 provides the count of opioid related deaths with the number of fentanyl positive cases being highlighted.
| 2015 | 2016 | 2017 | 2018 | 2019 | 2020 | 2021 | 2022 | 2023 | 2024 | |
|---|---|---|---|---|---|---|---|---|---|---|
| Fentanyl | 6 | 12 | 13 | 29 | 34 | 100 | 174 | 209 | 176 | 143 |
| Other Opioids | 153 | 124 | 125 | 116 | 109 | 80 | 85 | 89 | 85 | 59 |
| Total | 159 | 136 | 138 | 145 | 143 | 180 | 259 | 298 | 261 | 202 |
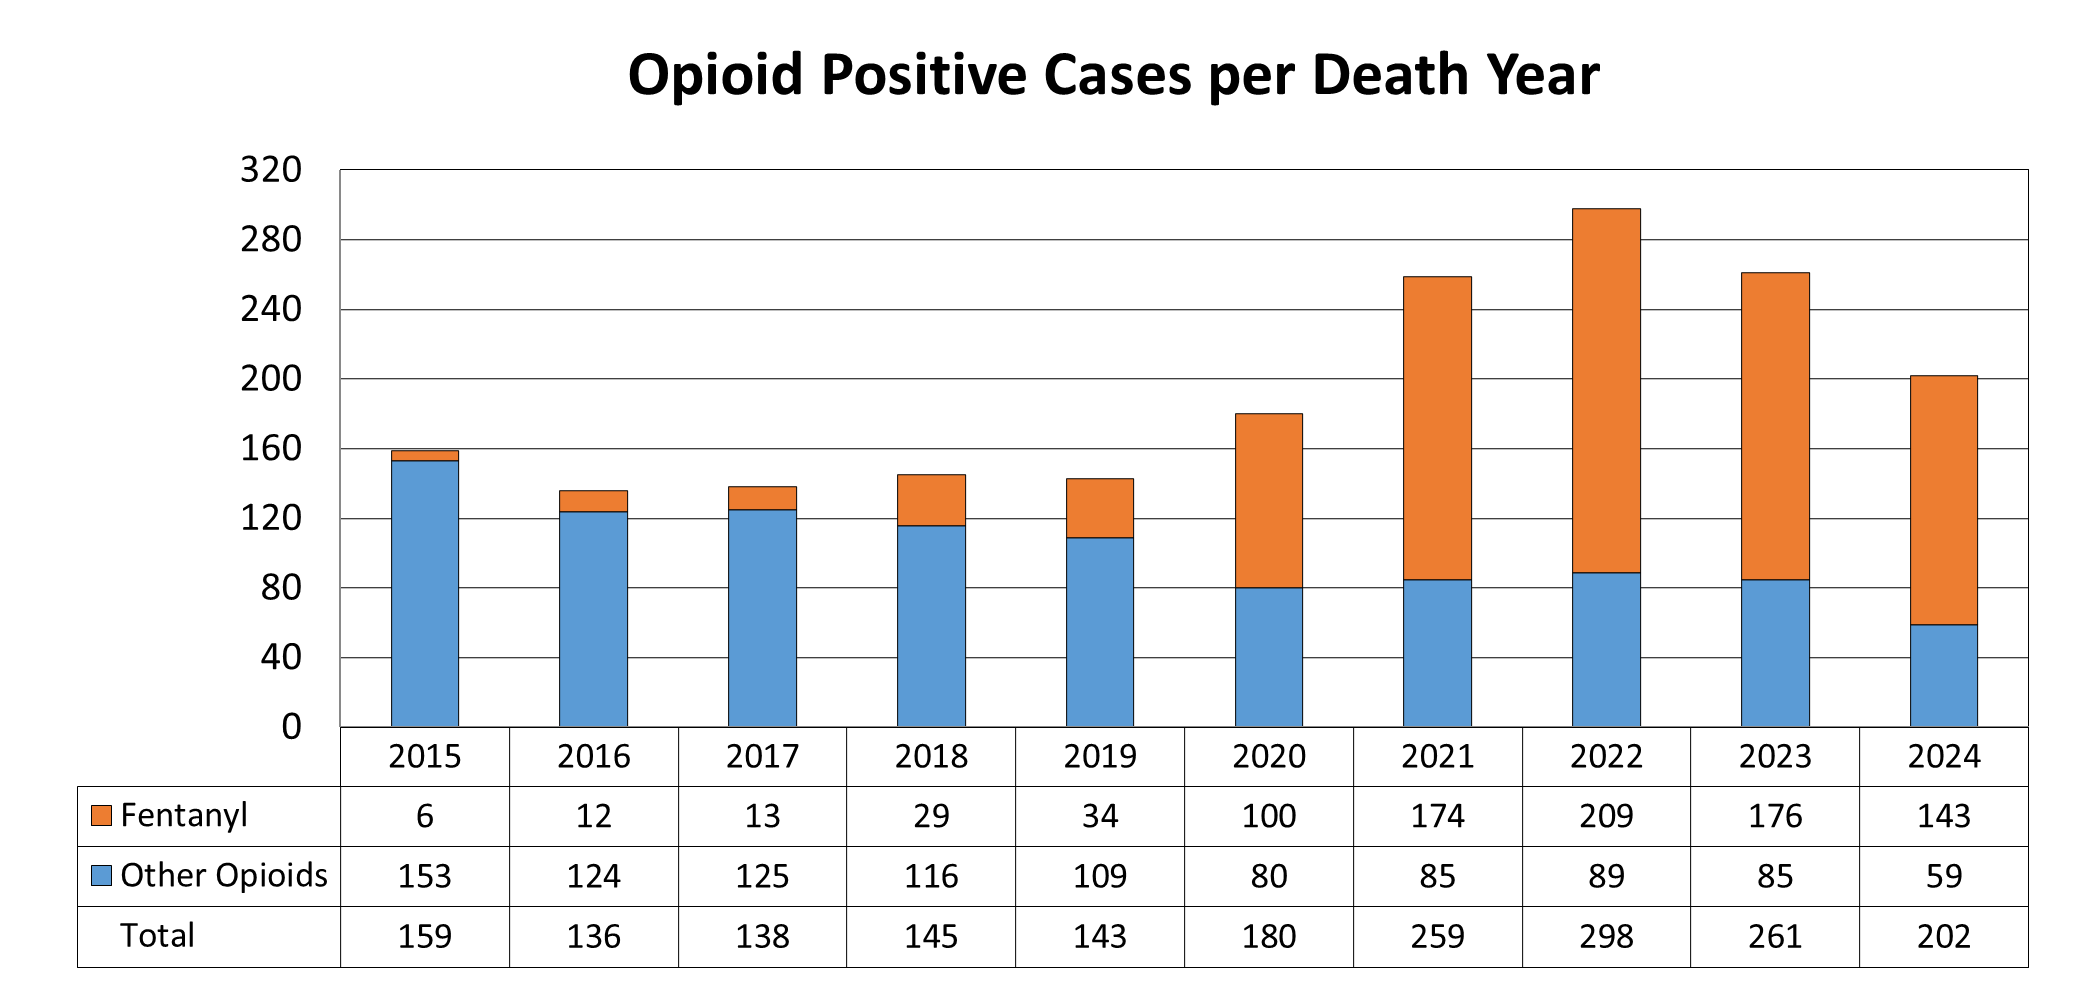
Table 3 illustrates the count of fentanyl positive drug related/overdose postmortem cases in 2024 within each age group. The greatest number of deaths in which fentanyl was detected occurred in the 30- to 39-year-old age group.
| Age Group | Number of Deaths (All Counties) | Number of Deaths (Sedgwick County) |
|---|---|---|
| 0-18 | 3 | 3 |
| 19-29 | 19 | 18 |
| 30-39 | 41 | 41 |
| 40-49 | 24 | 24 |
| 50-59 | 25 | 25 |
| 60-69 | 9 | 8 |
| 70-79 | 1 | 1 |
Table 4 illustrates the count of opioid positive postmortem cases per non-natural manner and cause of death. Additionally, there were 40 cases determined to be natural that the decedent had an opioid detected in their toxicology specimens.
| Manner of Death | Cause of Death | Number of Deaths |
| Accidental | OD Substance Toxicity | 136 |
| Accidental | Medical Miscellaneous | 7 |
| Accidental | Motor Vehicle Related | 4 |
| Accidental | Drowning | 2 |
| Accidental | Thermal Injuries | 2 |
| Accidental | Blunt Force Injuries | 1 |
| Accidental | CO Poisoning | 1 |
| Accidental | Fall | 1 |
| Accidental | Other | 1 |
| Homicide | Firearm Injuries | 4 |
| Suicide | Firearm Injuries | 10 |
| Suicide | Hanging Asphyxia | 3 |
| Suicide | OD Substance Toxicity | 2 |
| Suicide | Fire Exposure | 1 |
| Undetermined | MVA | 1 |
| Undetermined | OD Substance Toxicity | 1 |
| Unetermined | Undetermined | 1 |
Methamphetamine Positive Postmortem Cases
There was a total of 165 methamphetamine positive postmortem cases that had a non-natural manner of death. The range of methamphetamine positive non-natural death postmortem cases over the past 10 years is 71 in 2015 to 199 in 2022.
Table 5 illustrates the count of methamphetamine related deaths per non-natural manner and cause of death. Additionally, there were 10 cases determined to be natural where methamphetamine was detected in the decedent’s toxicology specimens.
| Manner of Death | Cause of Death | Number of Deaths |
| Accidental | OD Substance Toxicity | 107 |
| Accidental | Medical Miscellaneous | 10 |
| Accidental | Motor Vehicle Related | 9 |
| Accidental | Drowning | 4 |
| Accidental | Mechanical Restraint | 2 |
| Accidental | Suffocation Asphyxia | 1 |
| Accidental | Thermal Injuries | 1 |
| Accidental | Environmental Exposure | 1 |
| Accidental | Fall | 1 |
| Homicide | Firearm Injuries | 14 |
| Suicide | Firearm Injuries | 5 |
| Suicide | Hanging | 5 |
| Suicide | Drowning | 1 |
| Suicide | OD Substance Toxicity | 1 |
| Undetermined | Undetermined | 2 |
| Undetermined | Motor Vehicle Relate | 1 |
Benzodiazepine Positive Postmortem Cases
There was a total of 58 benzodiazepine positive postmortem cases that had a non-natural manner of death. The range of benzodiazepine positive non-natural death postmortem cases over the past ten years is 38 in 2015 to 118 in 2022.
Table 6 illustrates the count of benzodiazepine related deaths per non-natural manner and cause of death. Additionally, there were 12 cases determined to be natural where a benzodiazepine was detected in the decedent’s toxicology specimen(s).
| Manner of Death | Cause of Death | Number of Deaths |
| Accidental | OD Substance Toxicity | 29 |
| Accidental | Motor Vehicle Related | 6 |
| Accidental | Fall | 4 |
| Accidental | Medical Miscellaneous | 2 |
| Accidental | Blunt Force Injuries | 1 |
| Accidental | Drowning | 1 |
| Accidental | Hypothermia | 1 |
| Accidental | Other | 1 |
| Accidental | Thermal Injuries | 1 |
| Homicide | Firearm Injuries | 1 |
| Suicide | Firearm Injuries | 7 |
| Suicide | Motor Vehicle Relaed | 1 |
| Suicide | OD Substance Toxicity | 1 |
| Undetermined | OD Substance Toxicity | 1 |
| Undetermined | Undetermine | 1 |
Indigent Burials and Cremations
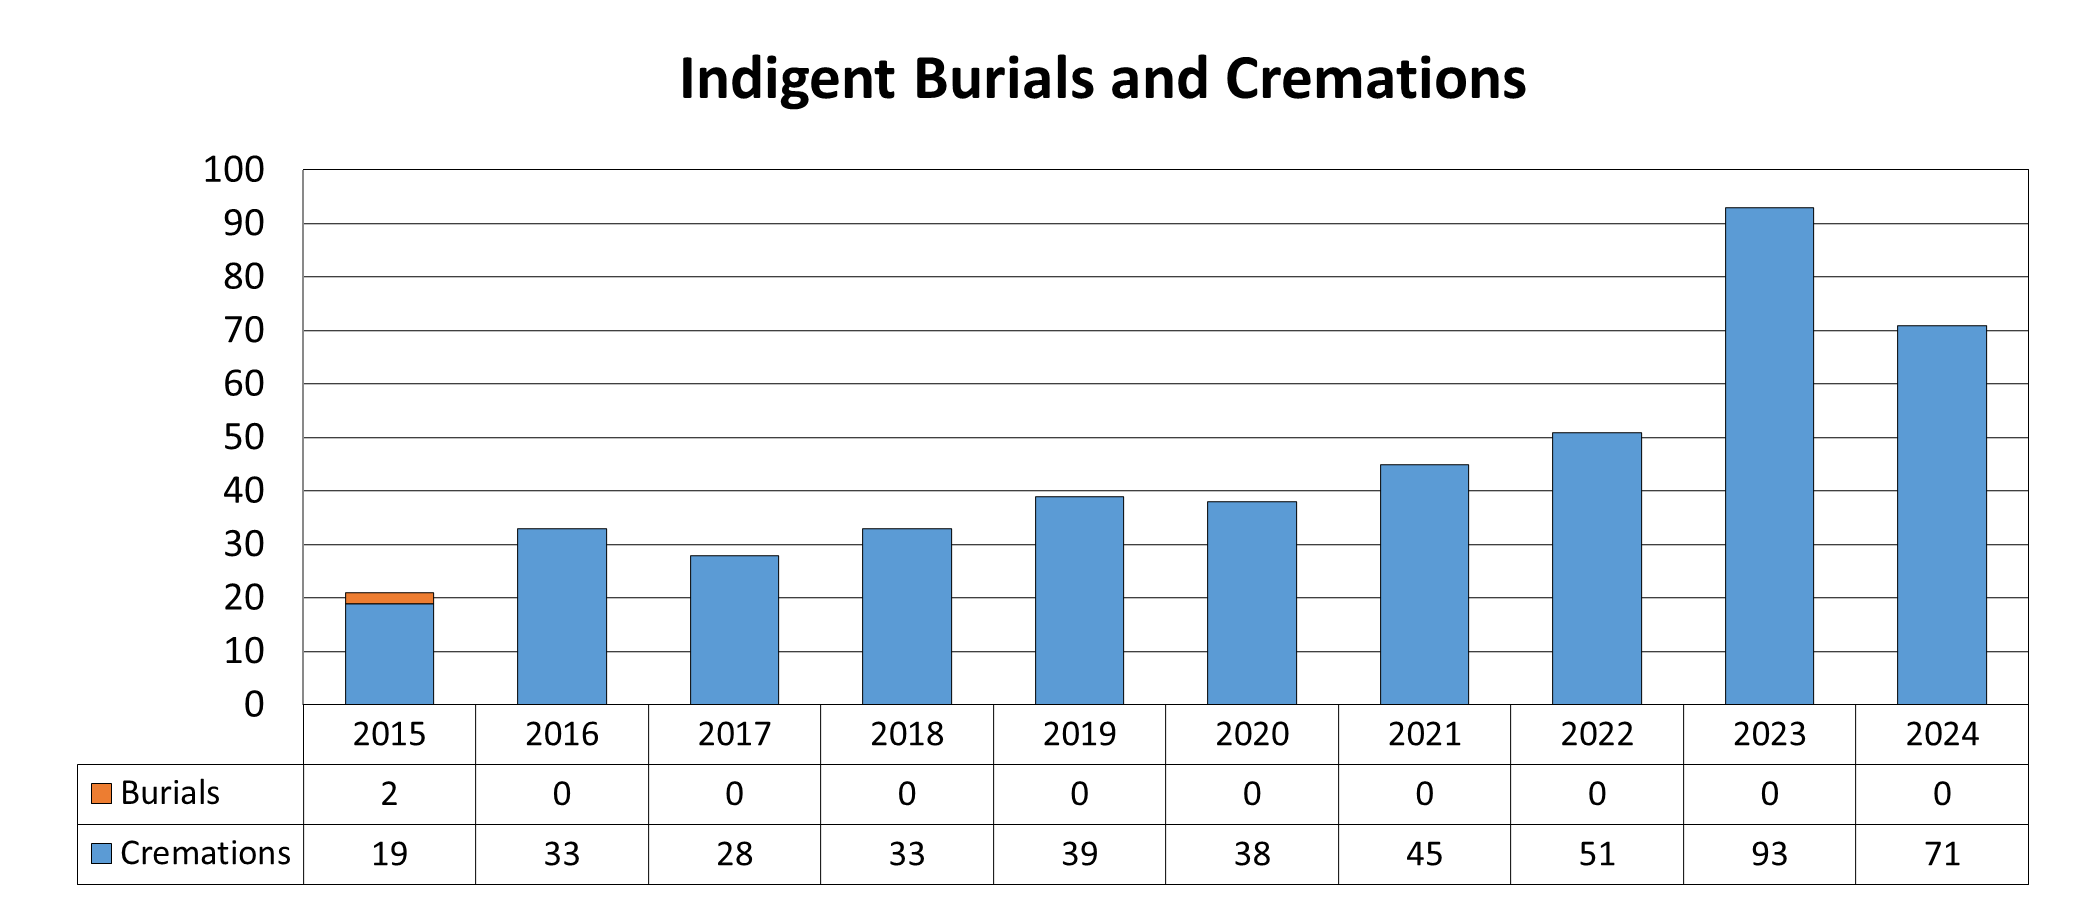
Bodies that are under the jurisdiction of the District Coroner's Office shall be delivered to the immediate family or the next of kin of the deceased. If after a diligent search, no family member or concerned party is found that is willing to claim the remains, pursuant to KSA 22a-215, Sedgwick County is required to provide final disposition for the bodies of unclaimed deceased persons. In accordance with this statute, a procedure has been established by the Center to facilitate the necessary arrangements regarding indigent cremations. The Center maintains a contract with a local mortuary service to handle the disposition of the remains.
As of 2016, the Center cremates all unclaimed bodies under its jurisdiction [Figure 29]. The cremains are retained indefinitely in a respectful manner.
Compared to 2015, there was an approximate 238.1% increase in the number of bodies provided a final disposition by the Center in 2024.
| 2015 | 2016 | 2017 | 2018 | 2019 | 2020 | 2021 | 2022 | 2023 | 2024 | |
|---|---|---|---|---|---|---|---|---|---|---|
| Burials | 2 | 0 | 0 | 0 | 0 | 0 | 0 | 0 | 0 | 0 |
| Cremations | 19 | 33 | 28 | 33 | 39 | 38 | 45 | 51 | 93 | 71 |
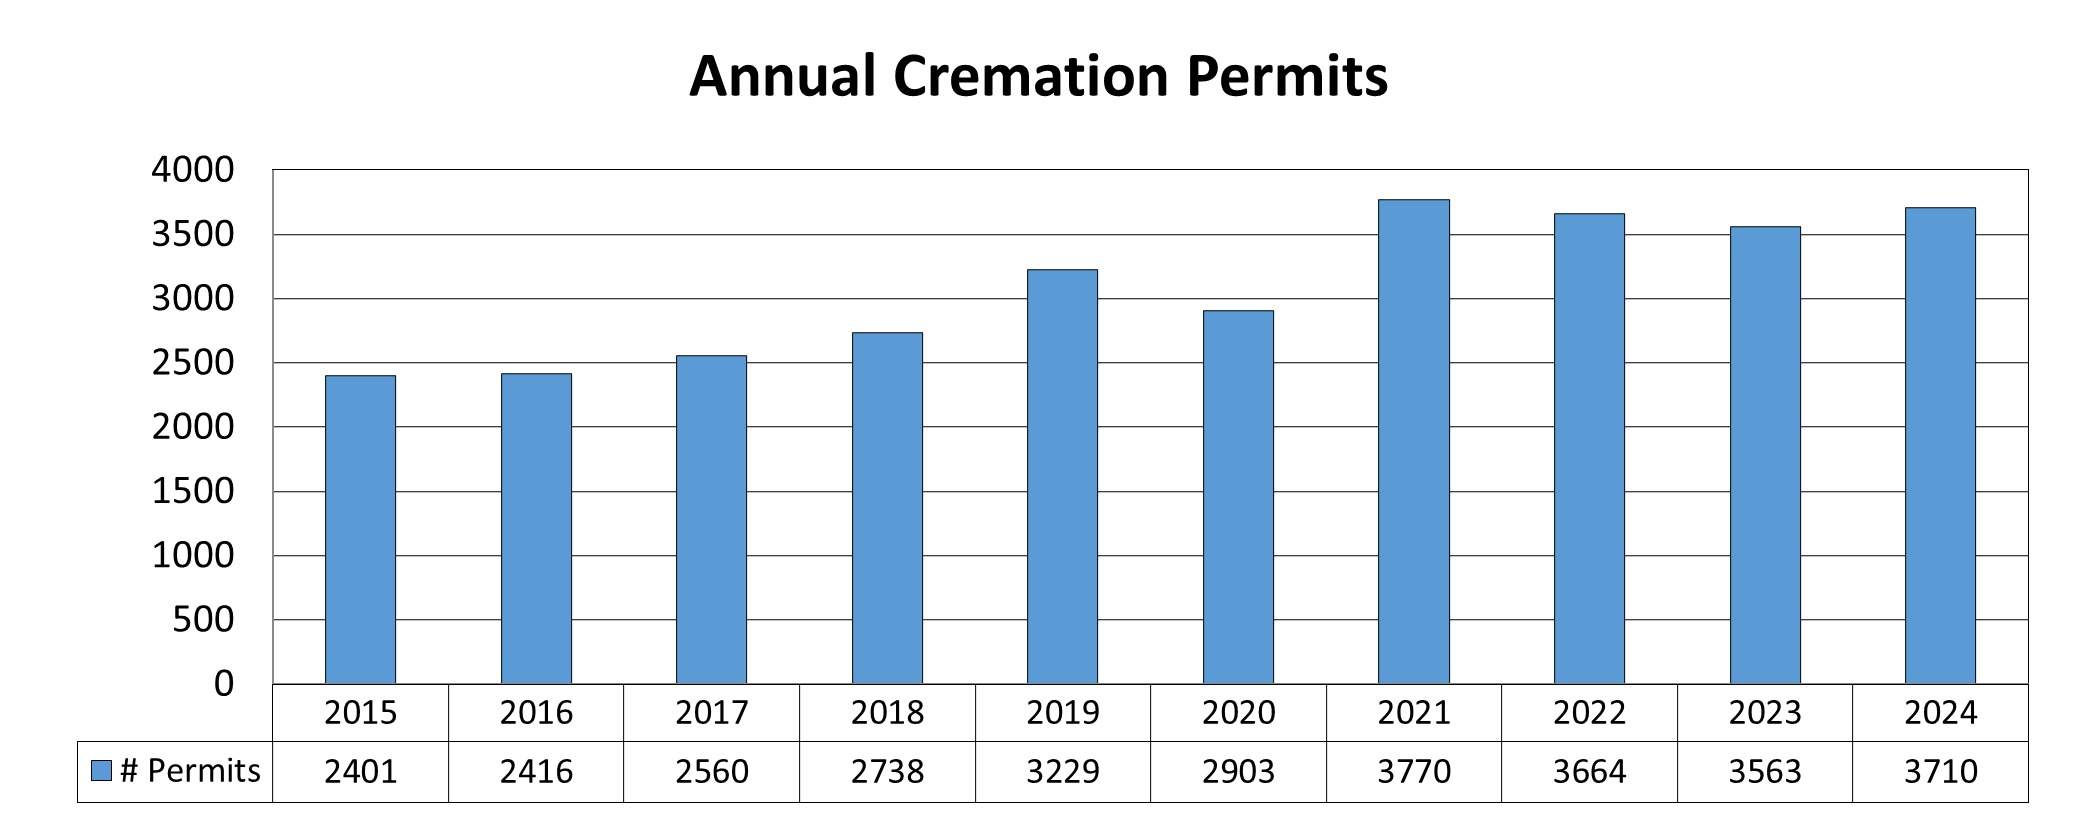
Cremation Permits
In the state of Kansas, the Coroner is also charged with the investigation of death if the body is to be cremated. The investigation involves confirmation that the death certificate is appropriately executed, and that no further circumstances exist which may have contributed to the death. This may involve interviews with medical personnel, families or other interested parties, and/or a review of medical records. If the cause of death is unclear or falls under the jurisdiction of the Coroner, a postmortem examination and issuance of a revised death certificate may be required prior to cremation. Figure 30 illustrates the number of cremations over the past 10 years. While the number of cremation permits in 2024 were similar to the previous 3 years, the permits did increase approximately 54.5% since 2015.
| 2015 | 2016 | 2017 | 2018 | 2019 | 2020 | 2021 | 2022 | 2023 | 2024 | |
|---|---|---|---|---|---|---|---|---|---|---|
| Number of Permits | 2401 | 2416 | 2560 | 2738 | 3229 | 2903 | 3770 | 3664 | 3563 | 3710 |